Friday, April 8, 2022
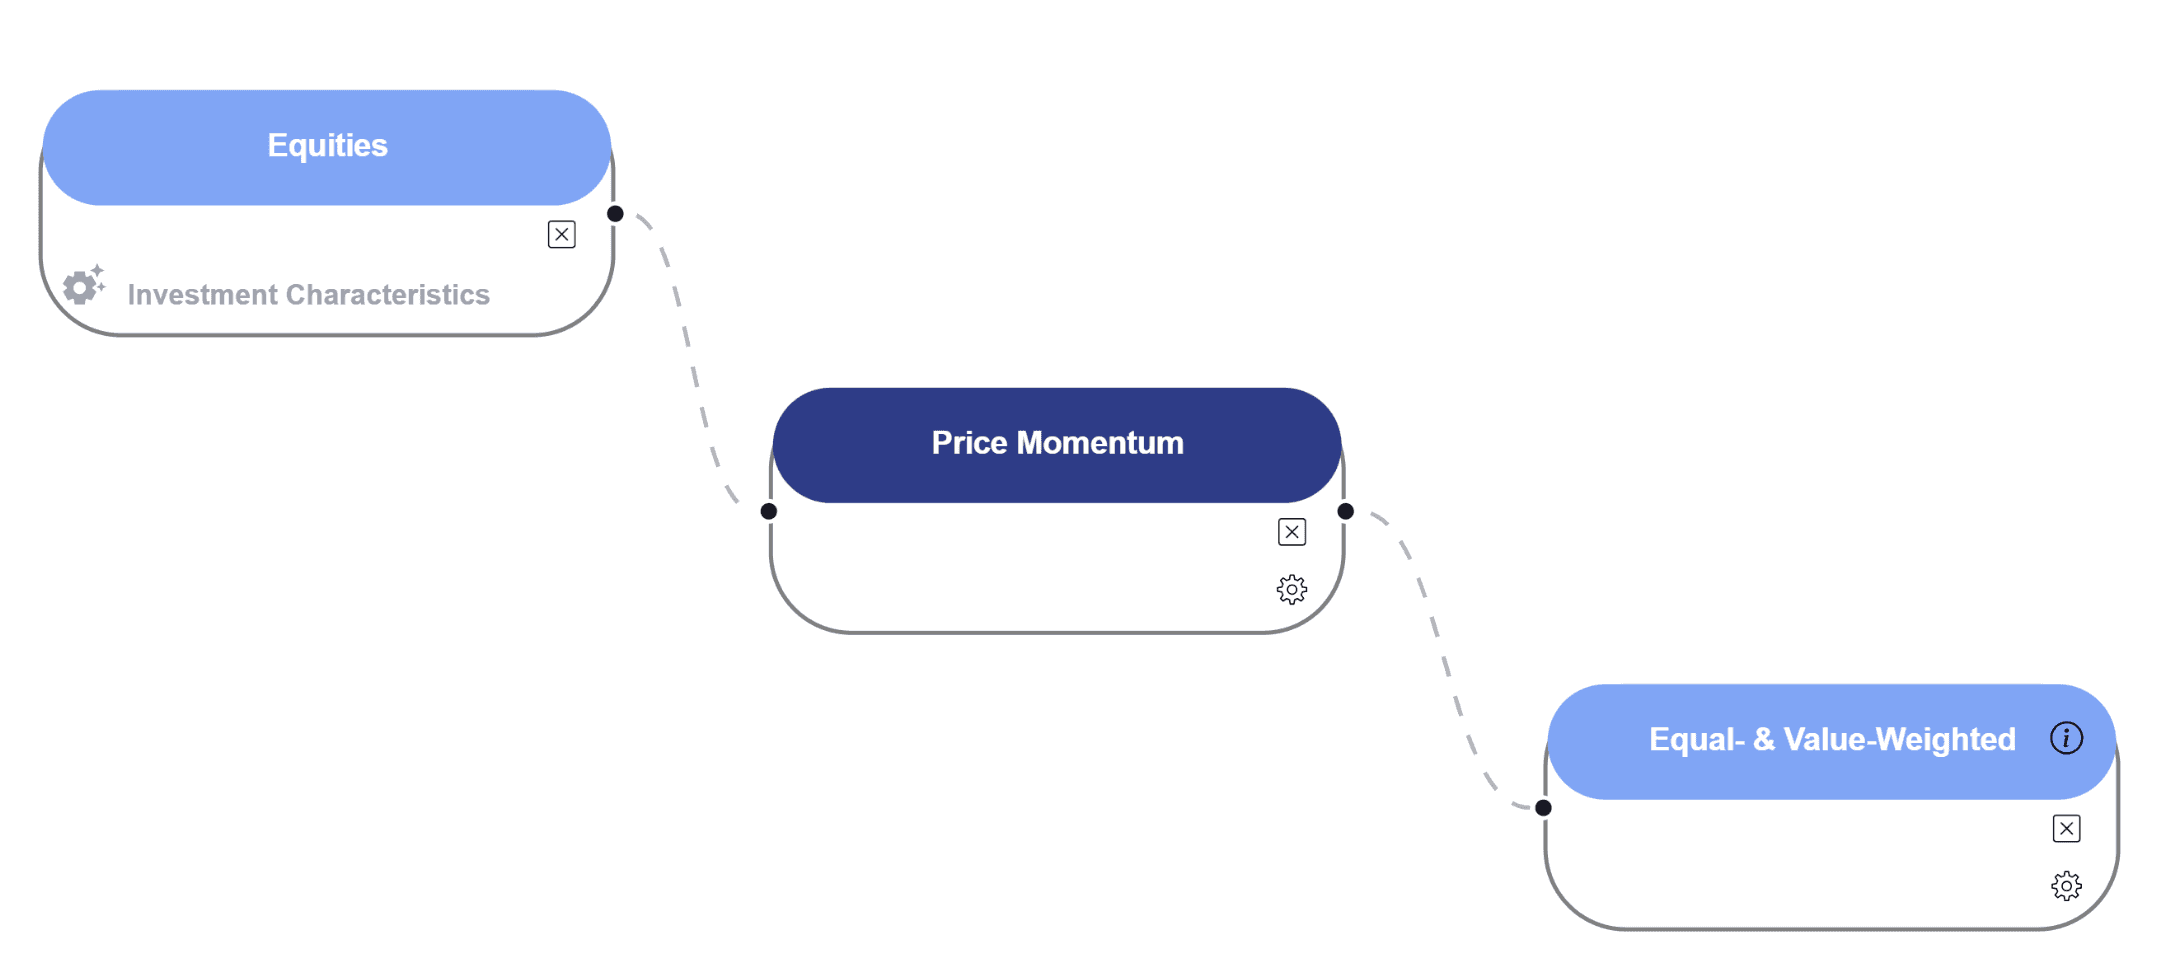
Momentum Strategy
The momentum strategy based on Price Momentum essentially focuses on the concept that stocks which have performed well in the past (winners) will continue to perform well, while stocks that have performed poorly (losers) will continue to perform poorly. The strategy is operationalized using a Formation Period Length, which is the time frame used to calculate the momentum. A minimum formation period length is also selected to ensure a minimum number of inputs for robust signal estimation. A positive price momentum implies a positive price trend, and conversely, a negative momentum implies a negative price trend.
The empirical basis for this strategy comes from a study by Jegadeesh and Titman (1993), which found that a trading strategy focused on buying past winners and selling past losers generates significant positive returns over 3- to 12-month holding periods. The authors show that the returns generated by this strategy are not driven by systematic risk or delayed stock price reactions to common factors. Instead, they propose that the evidence supports delayed price reactions to firm-specific information. However, the study also notes that these abnormal returns start to diminish after the first year.
This strategy challenges some academic theories that suggest price reversals in shorter or longer time frames and emphasizes the importance of the 3- to 12-month horizon for implementing a momentum strategy. It also notes patterns around earnings announcements, where past winners continue to outperform in the short term (7 months), but past losers outperform winners in the longer term (13 months).
So, if you're considering implementing a momentum strategy based on Price Momentum, you would buy stocks that have shown significant positive momentum over your chosen Formation Period Length (ideally 3-12 months according to the study) and sell or short stocks that have shown negative momentum over the same period.
Experimenting with QUANT NUCLEUS
In this article, our primary focus is to scrutinize the effectiveness of momentum trading strategies across different geographic markets—specifically, the United States, Europe, and the global arena.
Momentum Strategy in the United States
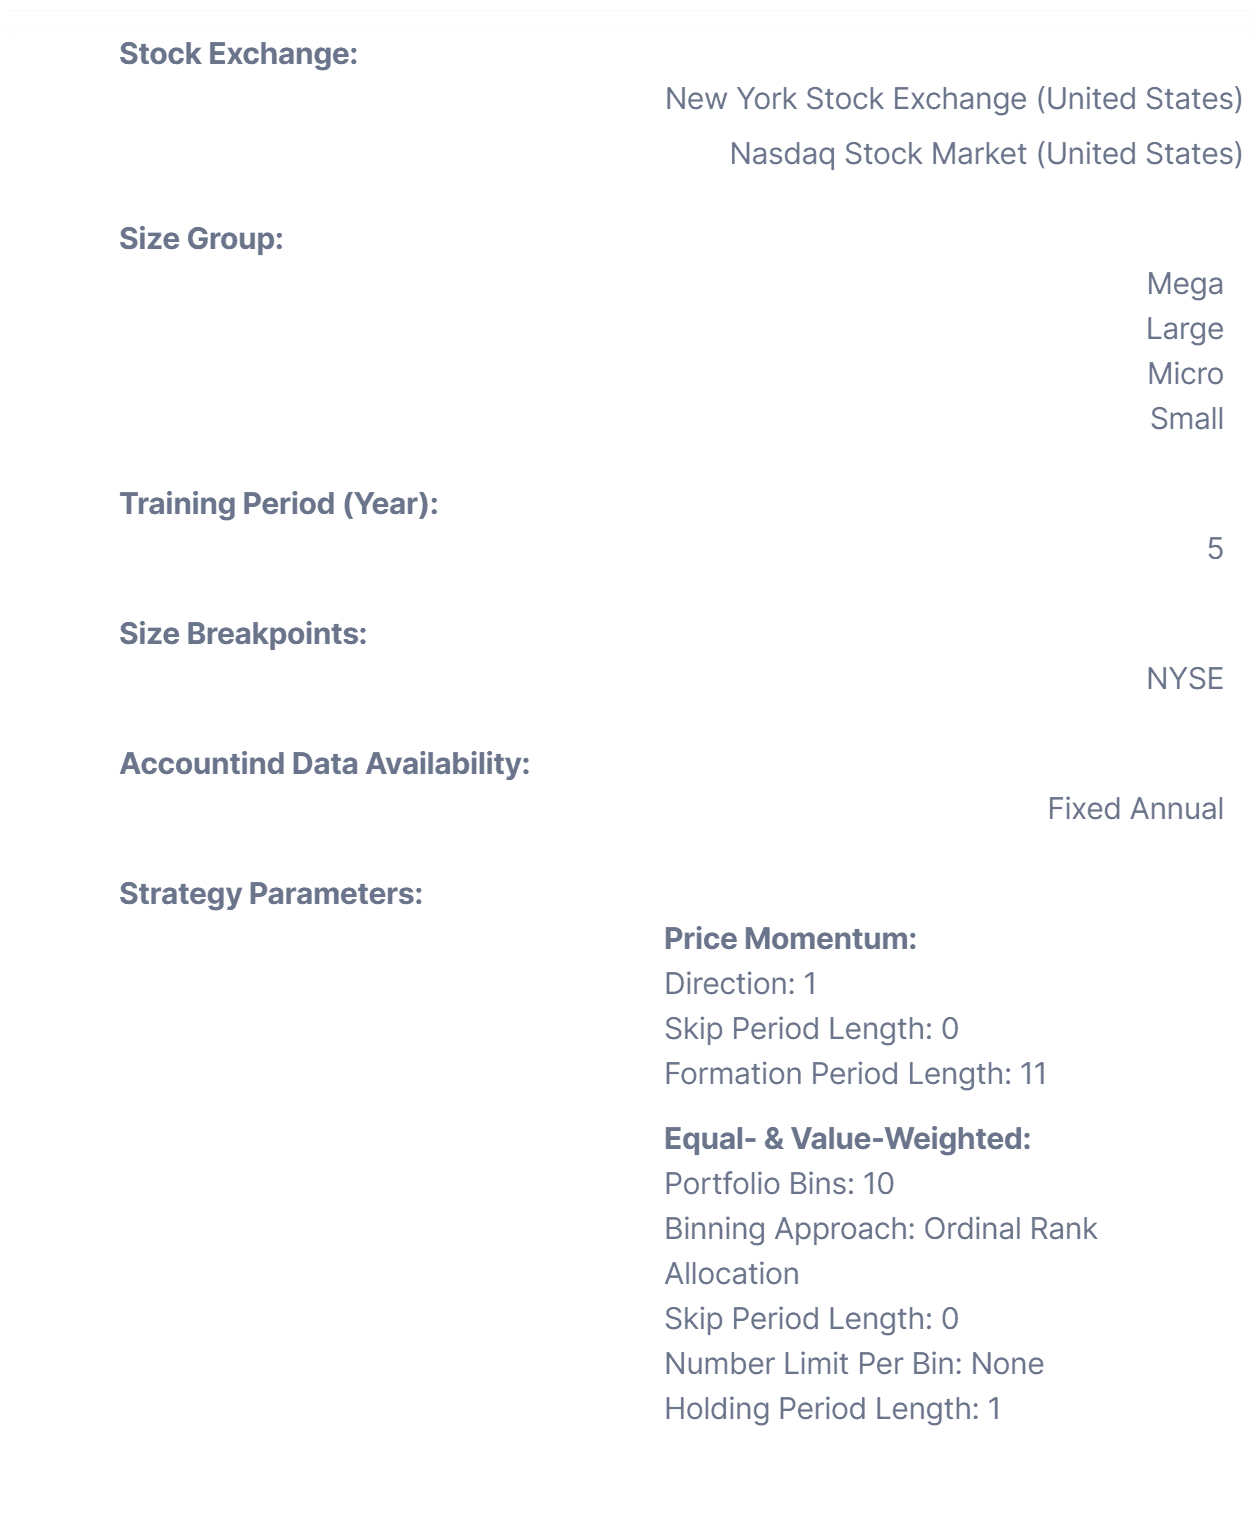
First, let's look at the United States. We set up our trading plan based on something called a "momentum strategy." This strategy involves buying and selling stocks based on their recent price trends. We only pick stocks that are bought and sold in the United States.
We also leave out very small companies, or "Nano-cap stocks," that aren't worth much compared to other companies listed on the New York Stock Exchange (NYSE).
Then, using our momentum rules, we divide the stocks into ten different groups (called "deciles") based on how well they're doing. We'll give more details about how we do this in the U.S. market below:
Below, we present the out-of-sample performance metrics for our momentum strategy. Notably, the long equal-weighted portfolio yields an annualized Sharpe ratio of 0.80, alongside an alpha of 7.13%. When compared to the market's excess return, which has a Sharpe ratio of 0.62, our momentum strategy clearly outperforms (Note that we also have the momentum Sharpe ratio of 0.24, that is the performance based on factor construction procedure - that is controlled for size of the stocks).

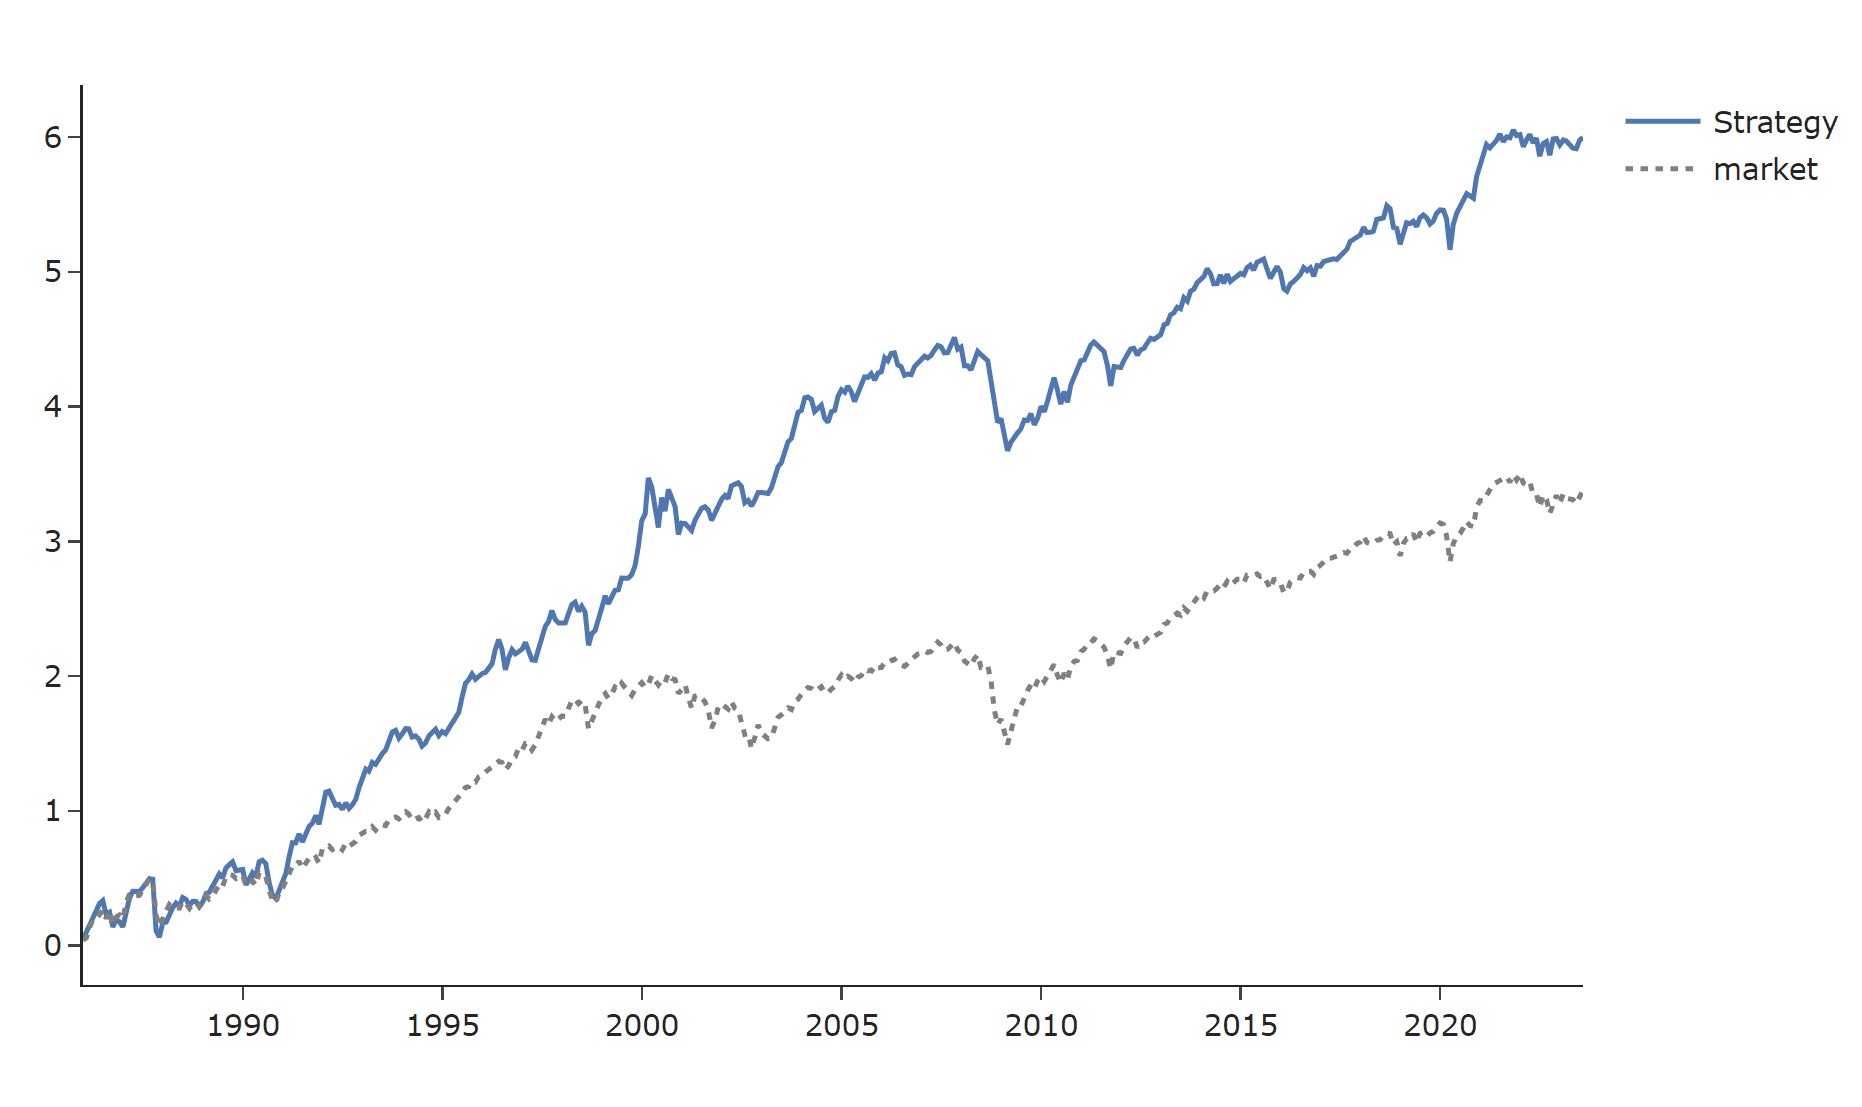
The following graph illustrates the equal-weighted cumulative log returns for the Momentum-based long equal-weighted portfolio. Notably, since 1985, the Momentum strategy has consistently outperformed the market-based approach, showcasing its robustness as an investment tactic over the long term.
Momentum Strategy in Europe
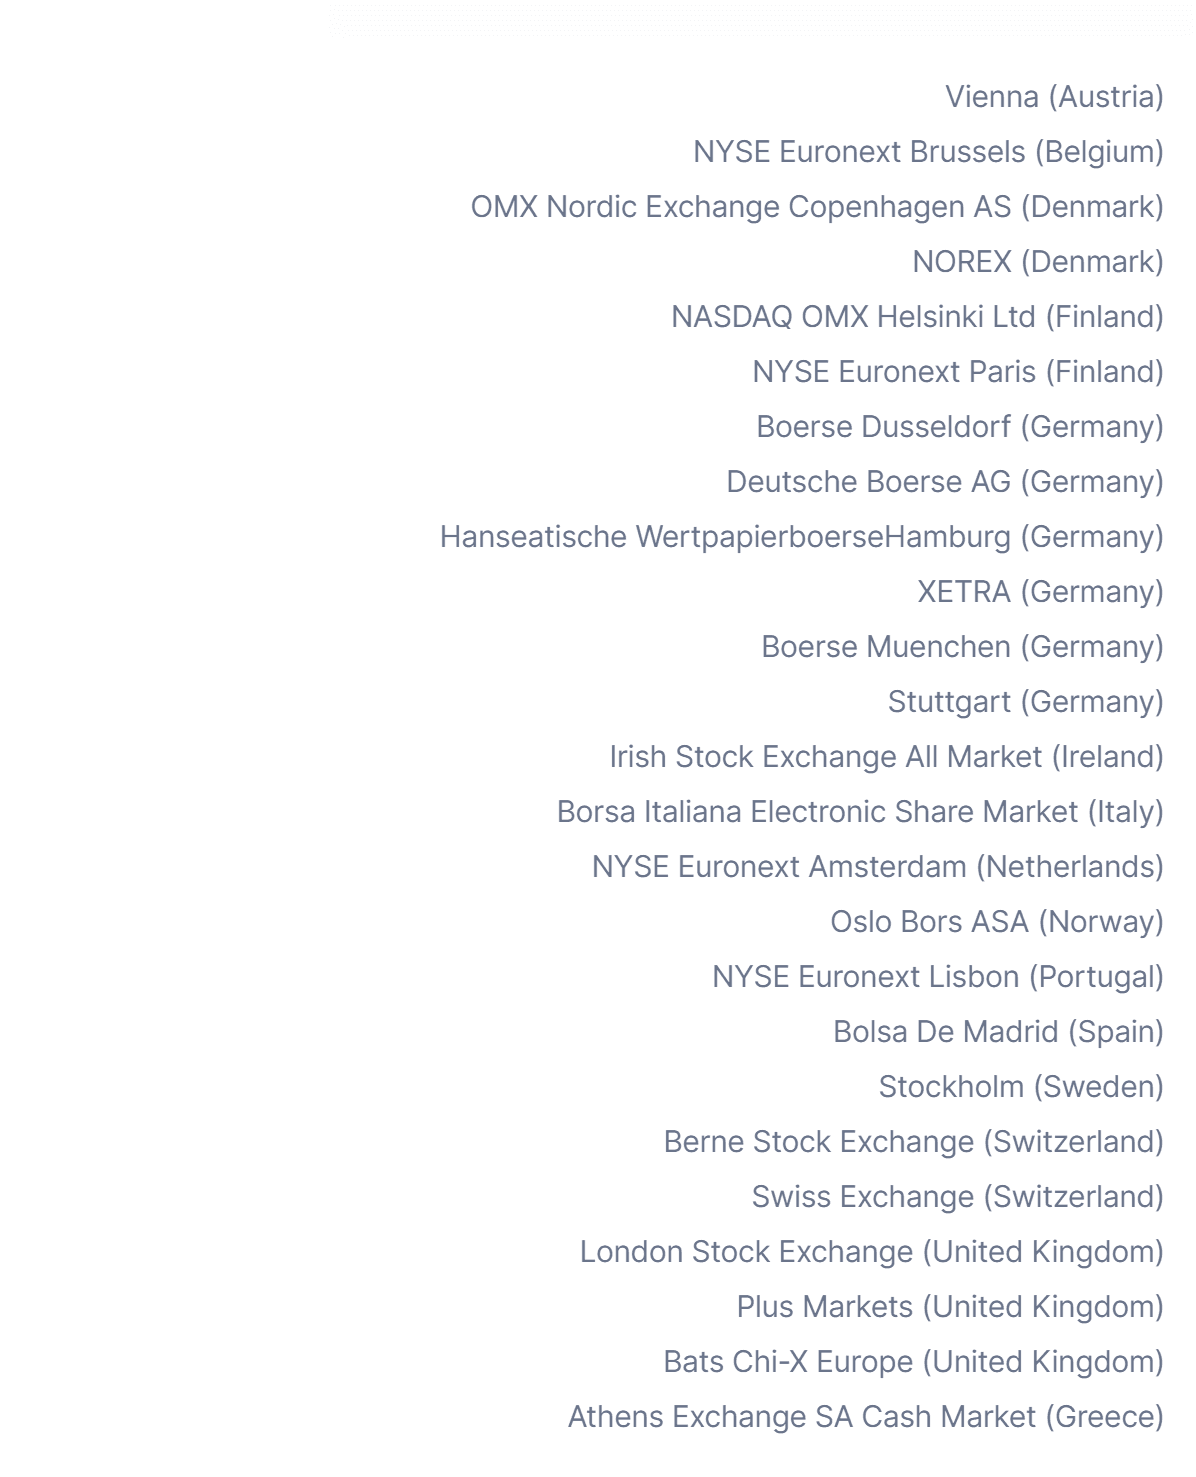
Next, we try out our momentum strategy with stocks in Europe. The upcoming graph will show you which European stock markets we looked at. We include all stocks from these markets to give us a full picture of how the strategy works in Europe.
The next graph will show some key numbers for how well our momentum strategy worked with European stocks. Specifically, it will show a Sharpe ratio of 0.90 and a CAPM alpha of 9.59%. These numbers tell us that the strategy did even better in Europe than it did in the United States. Keep in mind, the alpha number is calculated from the perspective of a U.S. investor. You can also see how the strategy has performed over time, in the Cumulative Log Return graph.

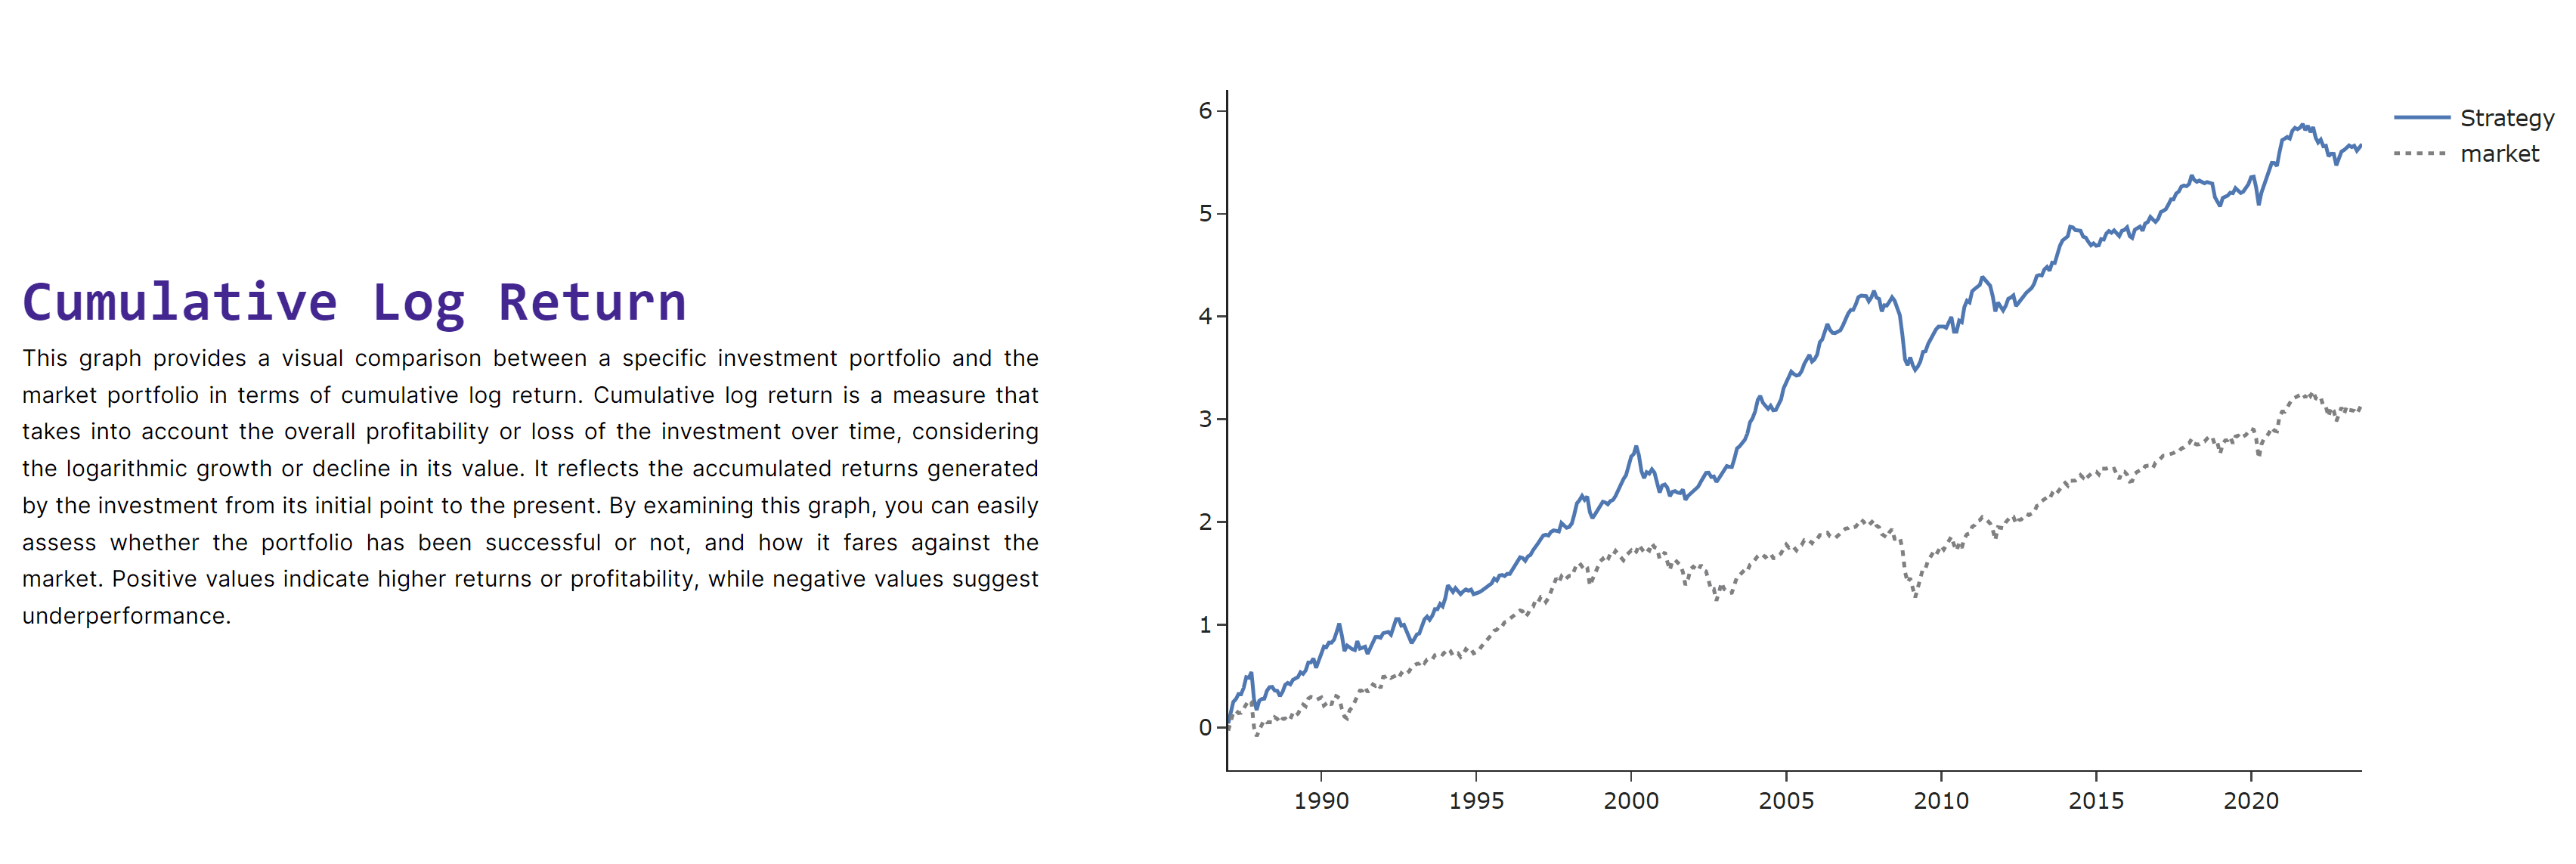
Up next, we delve into the alpha values for each of the ten different stock groups (known as deciles) using multiple factor models for analysis. It becomes evident that as we consider stocks with stronger momentum, the alpha values also increase.

Momentum Strategy in the World
Next, we expand the scope of our Momentum strategy to include stocks from around the globe. Featuring equities from various countries worldwide, we present the performance metrics for an equal-weighted long portfolio. Notably, we observe a Sharpe ratio of 0.83 and a CAPM alpha of 6.96%, offering insight into the strategy's global efficacy.

The following section features a Cumulative Log Return graph. This visualization makes it evident that the Momentum strategy outperforms, showcasing its robust effectiveness over time.

Conclusion
In a nutshell, how well the Momentum strategy performs can vary depending on where in the world you apply it. For instance, it worked especially well with European stocks in our study. Normally, comparing performances across regions would take a lot of time and effort. That's where Quant Nucleus comes. It lets you quickly test your investment ideas across different markets, making it easier for you to see which strategies work best.
Copyright © 2023 Juline Quant Inc.