Monday, February 28, 2022

Accrual accounting is an accounting method where revenue and expenses are recorded when they are earned or incurred, regardless of when the cash is actually received or paid. This is in contrast to cash accounting, where transactions are only recorded when cash changes hands. An investment strategy based on accruals would focus on identifying the differences between a company's reported earnings and its cash flows. The idea is that these differences can signal the quality and sustainability of a company's earnings. For example, high levels of accruals might indicate that a significant portion of a company's earnings are not backed by actual cash flow, which could be a red flag about the company's financial health and future performance. Conversely, low levels of accruals can be a positive sign that reported earnings are more likely to be sustainable in the future. Such a strategy could involve long positions in companies with low accrual levels and short positions in companies with high accrual levels. The rationale for this approach is supported by academic research showing that firms with lower accrual levels tend to have positive future abnormal stock returns, while those with higher accrual levels tend to have negative future returns. By systematically examining accruals in relation to total assets or earnings, an investor can gain valuable insights into a company's financial condition and future prospects, thereby potentially gaining an edge in the market.
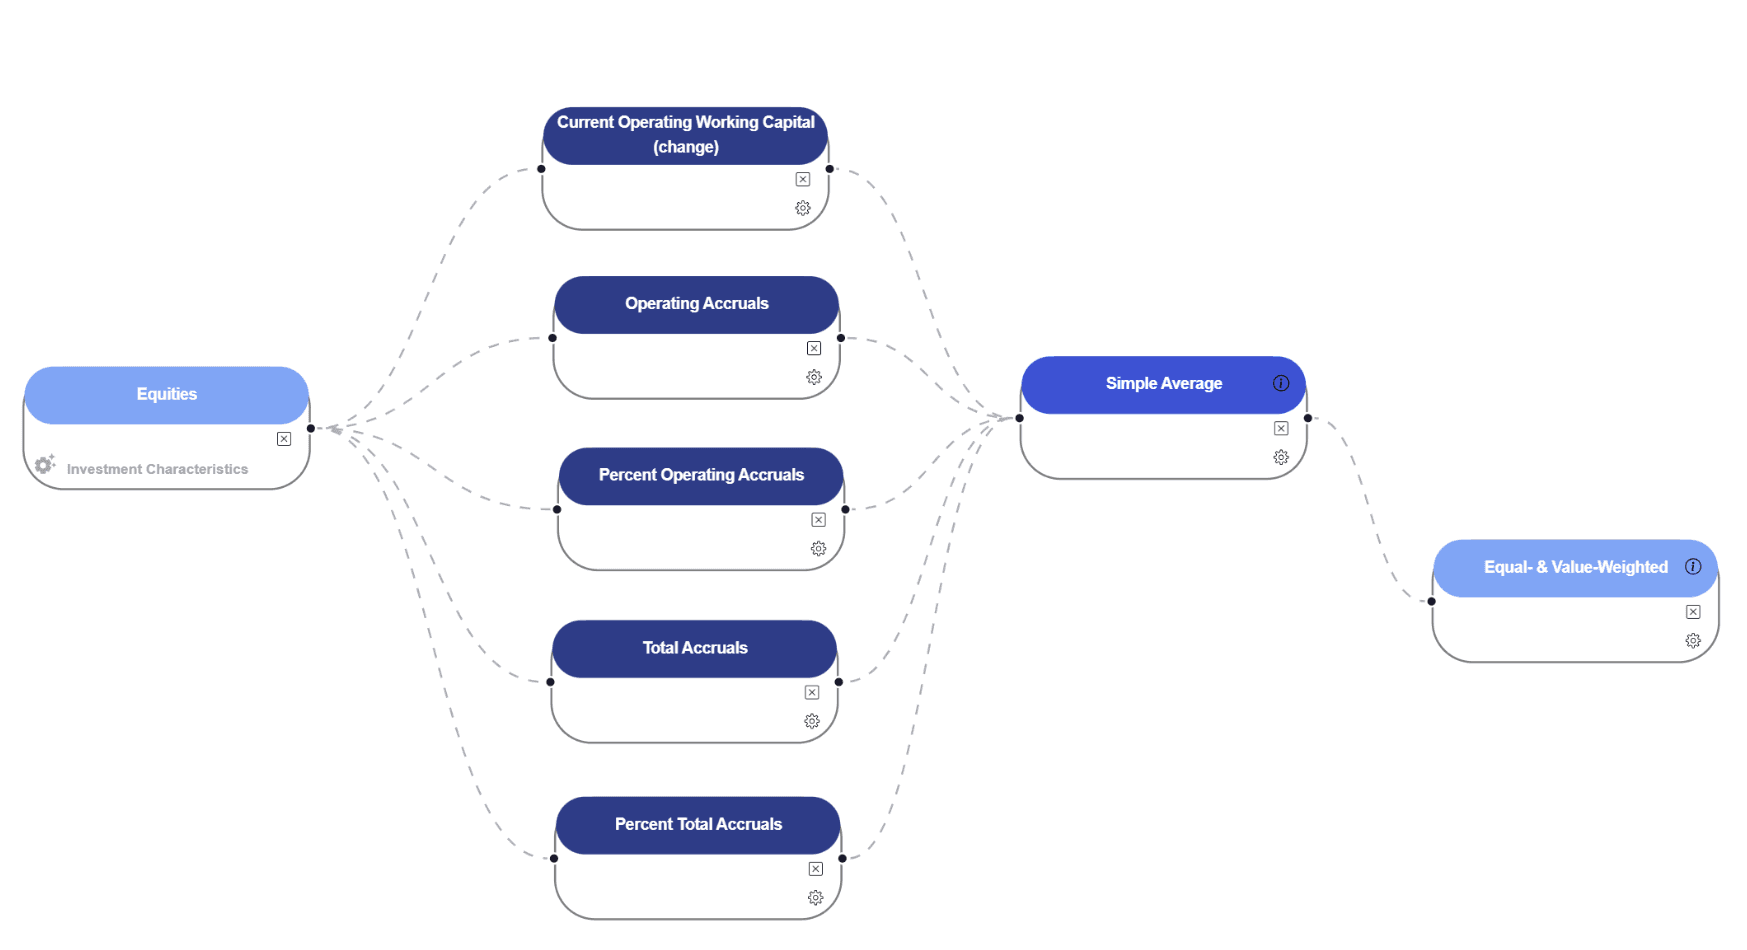
In this article, we aim to use several signals based on Accruals. Let's look into them:
Current Operating Working Capital (Change): This measures how much a company's "working money" changes over a year, adjusted for the total value of its assets. Imagine you're a shop owner. If you start the year with $100 for daily expenses and end with $150, that's a good sign. It means you have more money to operate your business. Similarly, investors use this measure to gauge if a business is improving or not.
Operating Accruals: This takes into account how much a company earned, but not necessarily received in cash. It's like sending an invoice but not getting paid yet. The signal tells you how much of the company's earnings aren't in cold hard cash. If this number is high, be cautious; the company might be reporting profits without the cash to back it up.
Percent Operating Accruals: This is similar to Operating Accruals but looks at how much of the company's profits are still 'on paper' (not yet received as cash) relative to its total profits. If a lot of a company's earnings are in this form, it's worth asking if those earnings are realistic and will eventually turn into cash.
Total Accruals: This is an even broader view that includes both Operating Accruals and other non-cash items. Think of it as the total amount of 'promised money' the company has but hasn't actually received or spent. This can be a helpful way to understand how much of a company's financial reporting is backed by actual money coming in or going out.
Percent Total Accruals: Just like Percent Operating Accruals, but for Total Accruals. It measures what percentage of a company's earnings are in the form of accruals, which are not yet realized as cash. If the percentage is high, it could be a red flag that the company's earnings might not be as solid as they seem.
In simple terms, all these indicators help you understand how much of a company's reported profits and expenses are 'real'—as in, backed by actual cash flow. They give you clues about the sustainability of a company's earnings. If a company reports high profits but most of it is still 'promised money,' that's a sign to dig deeper before investing.
Navigating Investments with Real Earnings Signals
The Accrual strategy is a specialized investment strategy designed for a wide array of stocks listed on the United States' most prominent stock exchanges—the New York Stock Exchange (NYSE) and the Nasdaq Stock Market. It aims to optimize stock selection across companies of varying sizes—from Mega to Micro—and is reliant on the latest available accounting data for its operation.
Characteristics:
Stock Exchanges: NYSE (United States), Nasdaq (United States)
Size Group: Mega, Large, Micro, Small
Size Breakpoints: NYSE
Accounting Data Availability: Latest Available
Strategy Parameters:
Accrual Signals:
Total Accruals, Operating Accruals, Percent Total Accruals, Percent Operating Accruals, and Current Operating Working Capital (change):
Skip Period Length: 0 (No skip in time, the strategy uses the latest available data.)
Simple Average:
Scaling: None
Approach: Ranked Average
Equal- & Value-Weighted Portfolio:
Portfolio Bins: 10 (Stocks are sorted into 10 bins based on accrual levels.)
Binning Approach: Ordinal Rank Allocation
Skip Period Length: 0
Number Limit Per Bin: None
Holding Period Length: 1 (Presumably in years, depending on your specific setup)
How It Functions:
Data Collection: The strategy first gathers the most up-to-date accounting information, while also considering the size of companies based on NYSE breakpoints.
Accrual-Based Signal Analysis: The primary feature of this strategy is its focus on various accrual signals like Total Accruals, Operating Accruals, Percent Total Accruals, Percent Operating Accruals, and changes in Current Operating Working Capital. Stocks are targeted if they have lower levels of these accruals, which is generally seen as a positive indicator of earnings quality.
Average Ranking: The strategy employs a Simple Average approach, scaling none and using a ranked average methodology to bring it all together.
Portfolio Assembly: Stocks are then sorted into 10 ordinal bins based on their ranking. Each bin can be either equal-weighted or value-weighted depending on the investor's preference.
Holding Period: The stocks are held for a period of 1, likely representing one year, after which the portfolio is reassessed.
The strategy provides investors a structured yet flexible framework to select stocks with greater earnings quality. By focusing on lower accrual levels and leveraging a sophisticated ranking system, the strategy aims to outperform the market consistently. It offers a nuanced but straightforward approach to accrual-based investment, targeting companies that are more likely to provide sustainable returns over the long term.
Performance
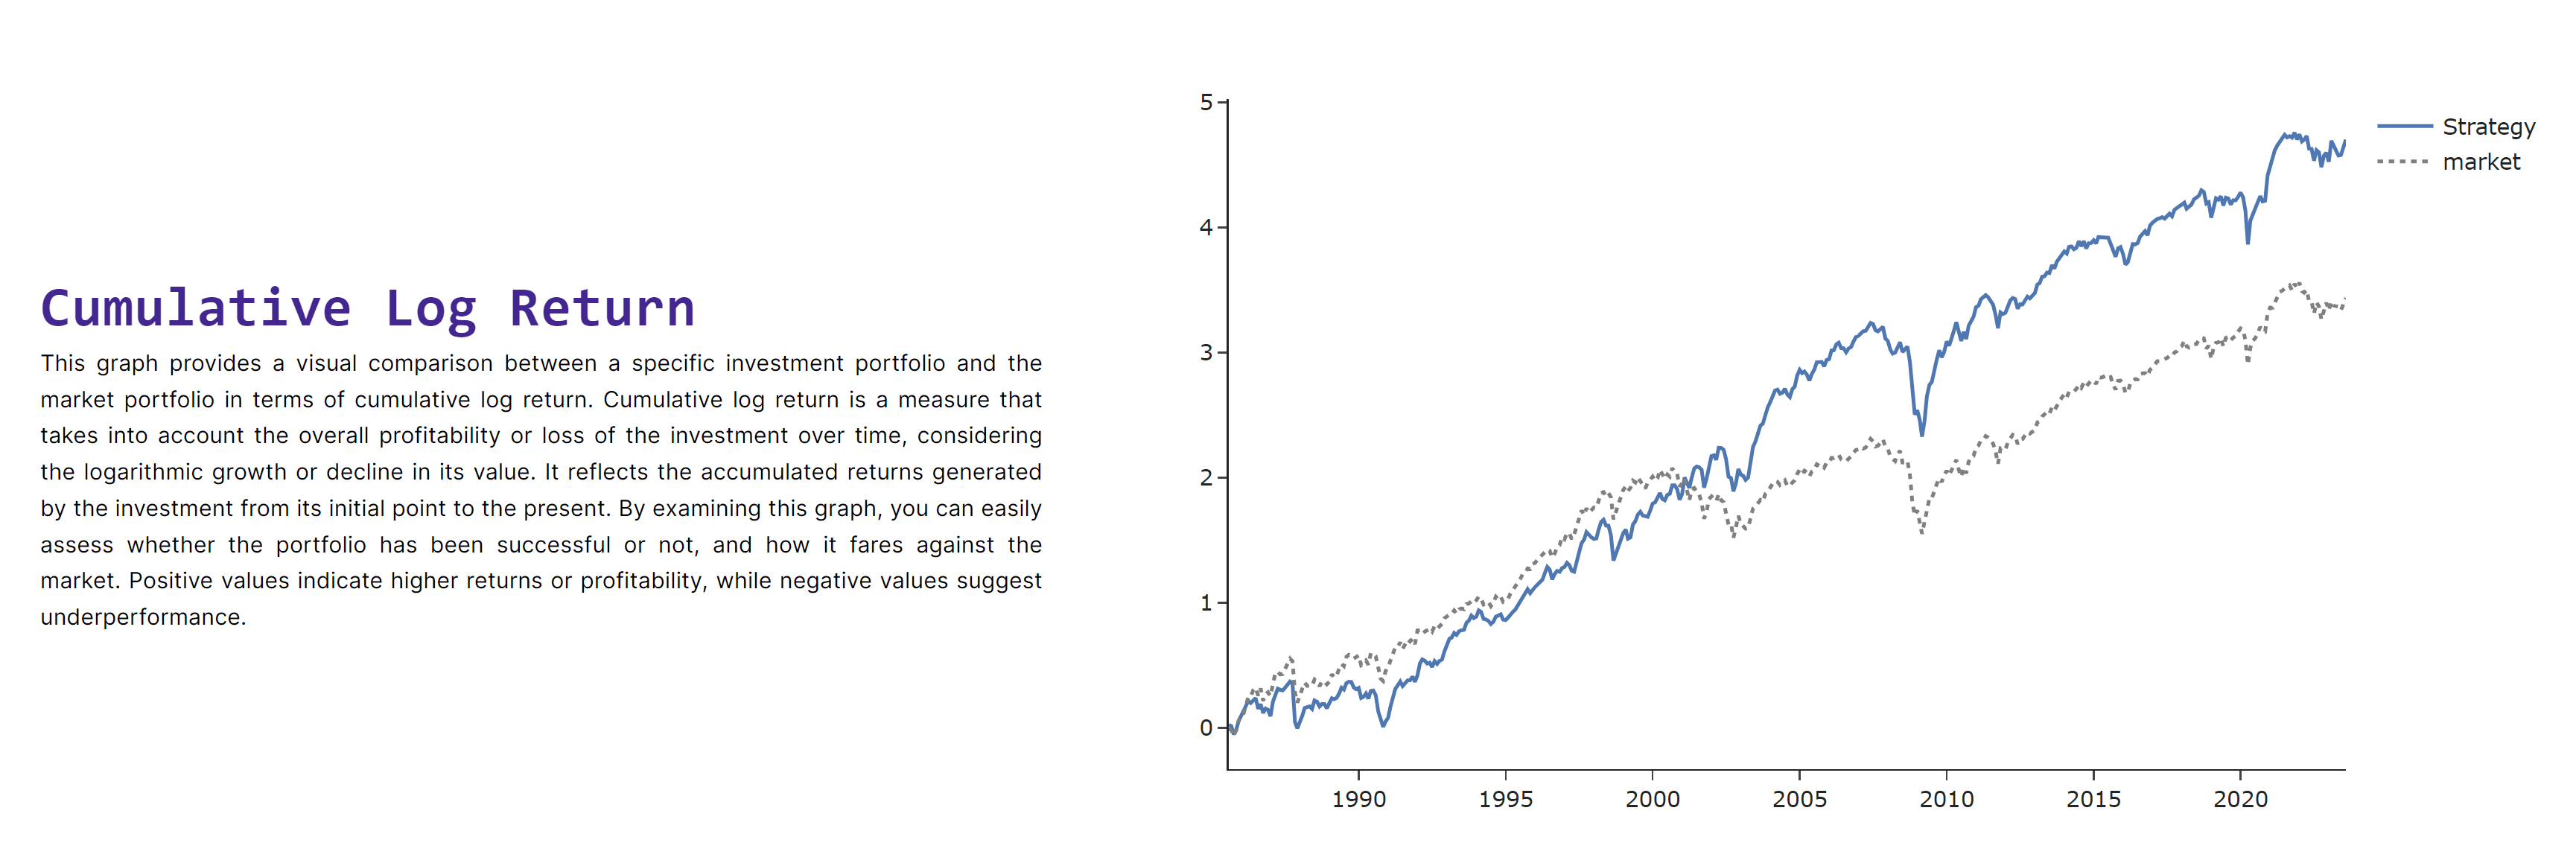
The strategy has shown significant strength with an annualized average return of 14.40%, outperforming the market's excess return of 10.44% quite comfortably. The Sharpe Ratio stands at an impressive 0.73, which signifies that the strategy has done well in offering good returns for the level of risk taken. Furthermore, the strategy exhibits a very low turnover rate of 0.02%, making it extremely cost-efficient in terms of transaction costs. The Alpha, an indicator of the strategy's ability to beat the market, is also noteworthy at 3.03% with a statistically significant t-stat of 2.34.

On the flip side, there is a somewhat elevated level of risk involved, as indicated by an annualized volatility of 19.61%. This is higher than the market's excess return volatility, which stands at 16.59%. The Beta of 1.08 also indicates that the strategy is slightly more volatile than the market. However, given the high average returns and the solid Sharpe Ratio, this level of risk may be justifiable for investors who are looking for high-reward opportunities and are willing to absorb some additional risk. Overall, the strategy provides a compelling blend of high returns and efficiency but should be employed within the context of a diversified portfolio for risk mitigation.

Enhanced Strategy Utilizing Elastic Net for Accrual Signals
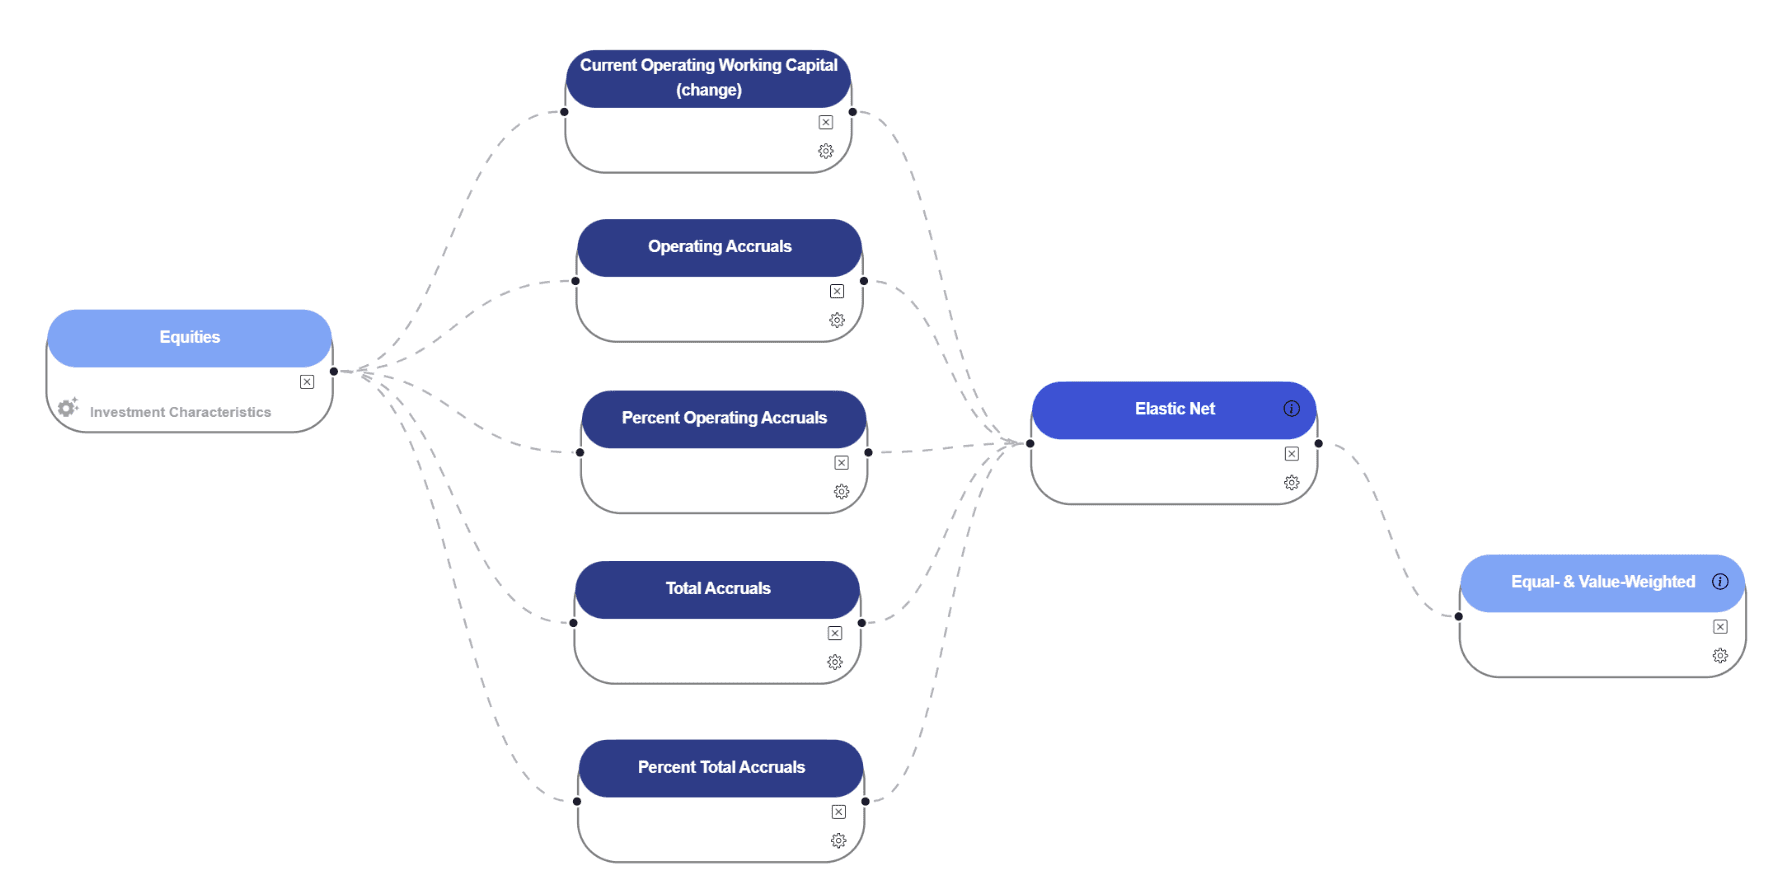
After reviewing the performance metrics and considering the complexity of the financial variables involved, we decided to incorporate Elastic Net into our strategy to train the accrual signals. Elastic Net is particularly useful for dealing with multicollinearity and offers a balanced regularization process through its L1 and L2 penalties. We set the Elastic Net parameters with an Alpha of 1 and an L1 ratio of 0.5, allowing the model to learn the optimal weight for each feature. The maximum iteration is capped at 1000 to ensure convergence.
In line with our continuous effort to improve our investment strategy, this enhancement aims to optimize our stock selections and mitigate the risk of overfitting. We maintain our focus on a range of accrual metrics, including total accruals, operating accruals, percent total accruals, and changes in current operating working capital, each having a direction of -1 to reflect our bearish perspective on accrual-based indicators. Our portfolio still operates across a variety of firm sizes—ranging from mega to small—and is spread over NYSE and Nasdaq exchanges. We continue to categorize our portfolio into 10 bins using ordinal rank allocation, with no specific number limit per bin, keeping the holding period at one year. This refined approach aims to further solidify our position in the market by optimizing the predictive power of our accrual signals.

Performance
The addition of Elastic Net to train the accrual signals in our investment strategy has led to improvements in performance metrics. The annualized Sharpe Ratio has increased from 0.73 to 0.76, indicating a more favorable risk-adjusted return. While the Average Return has slightly decreased from 14.40% to 13.80%, this came with reduced volatility (from 19.61% to 18.15%), enhancing the overall risk profile of the portfolio. The most dramatic change is in the CAPM-based Alpha, which surged from 3.03% to an impressive 6.32%, with a t-statistic of 4.56, signifying that the strategy's outperformance is statistically significant.


Conclusion
In conclusion, the integration of Elastic Net in training the accrual signals has added a layer of sophistication and optimization to our investment strategy. This machine learning approach has resulted in improvements in several key performance indicators, most notably in risk-adjusted returns and alpha. The modification has also led to a more balanced and diversified portfolio, reducing its dependence on single factors like momentum. The rise in the annualized Sharpe Ratio, a decrease in volatility, and a significant jump in alpha all underscore the strategy's improved ability to deliver robust, risk-adjusted returns. Overall, the enhanced strategy demonstrates the effectiveness of incorporating advanced statistical methods into financial modeling.
Copyright © 2023 Juline Quant Inc.