Wednesday, January 12, 2022

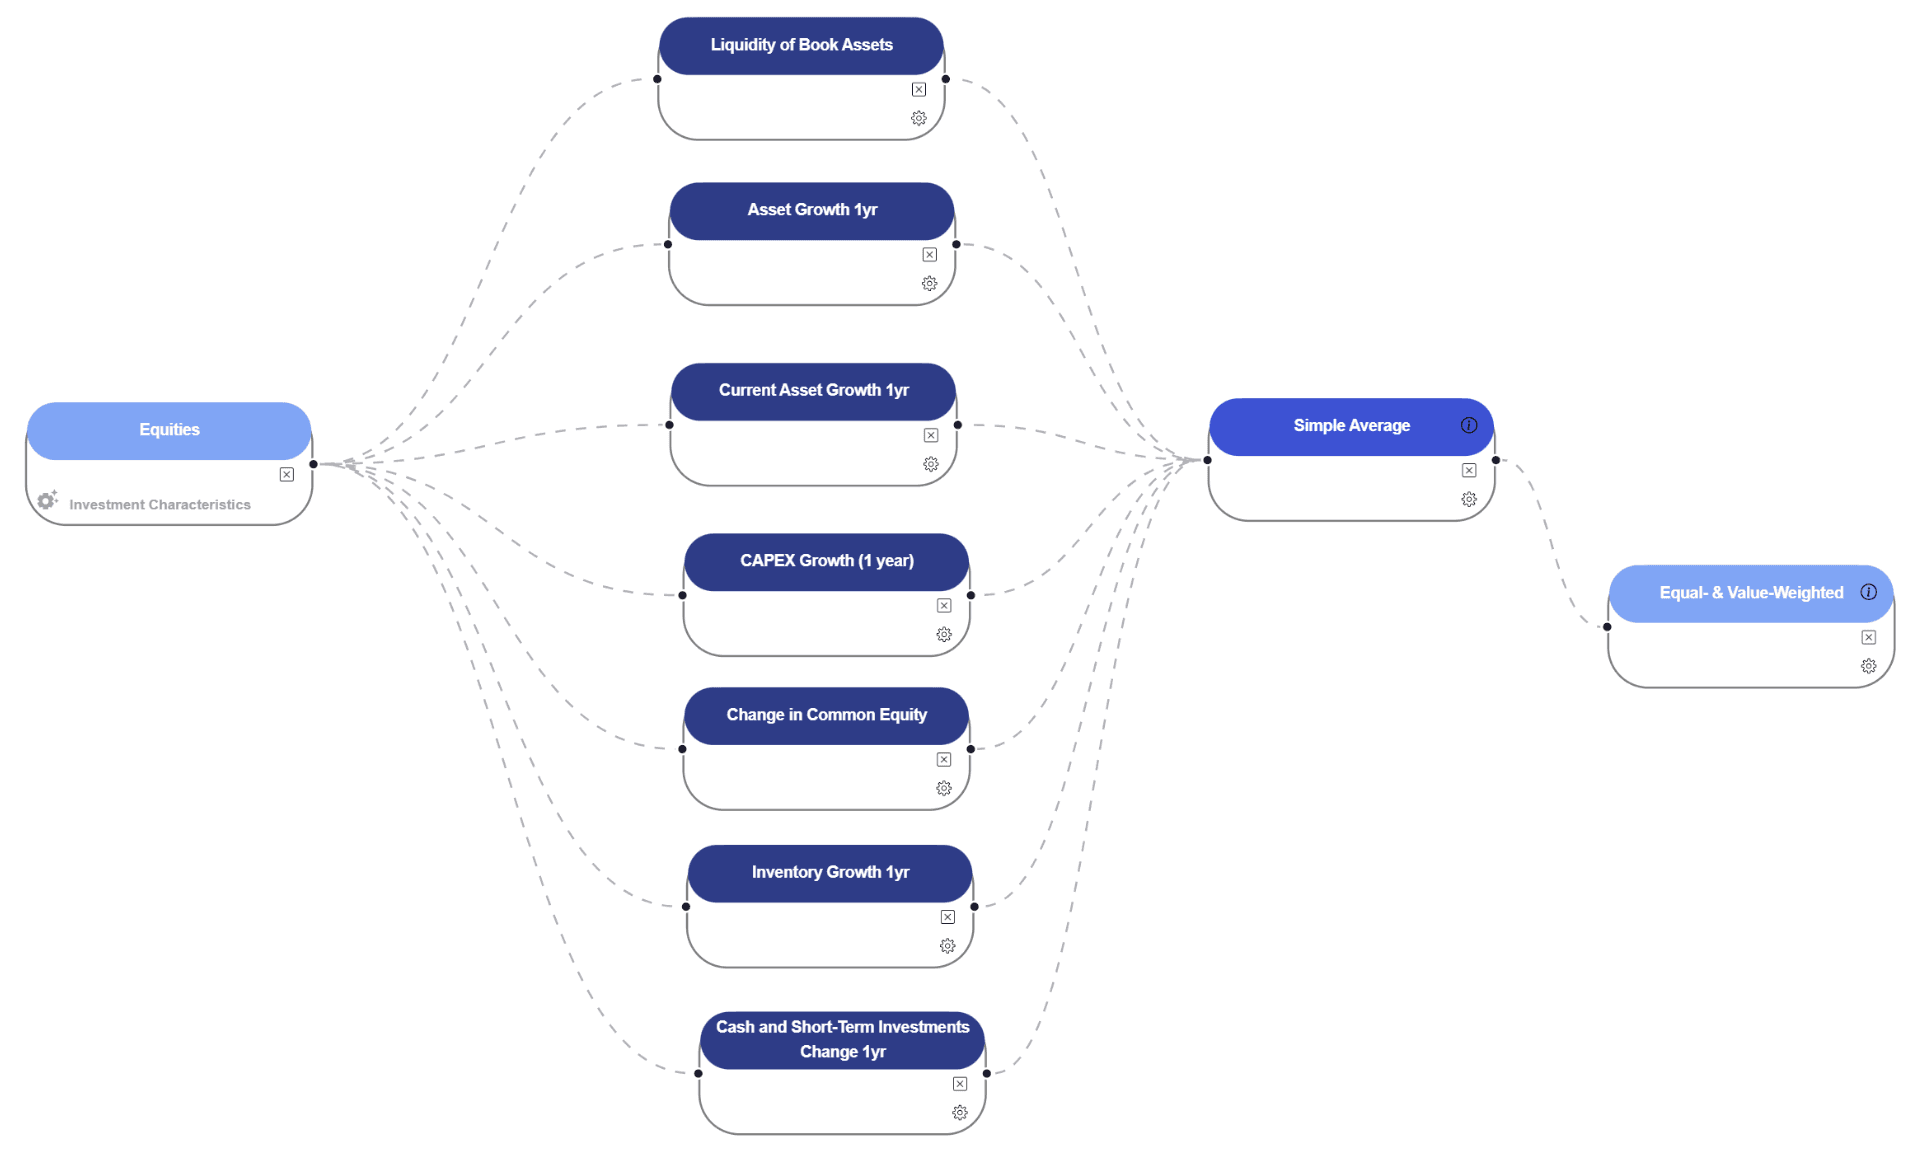
In the quest to construct a comprehensive and effective investment strategy, we are integrating multiple financial signals. These signals are designed to provide nuanced insights into various aspects of a company's financial health and performance, thereby enabling us to make more informed investment decisions. Below is a brief overview of each signal and its relevance to our strategy:
Liquidity of Book Assets: This signal gauges a company's ability to convert its book assets into cash in a short timeframe. The ratio of average liquid assets to average total assets gives us an indication of a company's short-term financial health. Firms with higher liquidity ratios are generally more stable, better positioned to meet immediate obligations, and have a lower cost of capital.
Asset Growth 1yr: This metric calculates the year-over-year percentage change in a company's total assets. Positive asset growth signifies company growth, while negative growth could indicate declining operations. This signal is a strong predictor of U.S. stock returns and remains robust across different firm sizes.
Non-Current Asset Growth 1yr: This specific metric measures the year-over-year growth in a company's non-current assets, such as property, plant, and equipment. It helps us understand the company's commitment to long-term growth and how it's allocating capital to fixed assets.
CAPEX Growth (1 year): This signal assesses the rate of growth in a company's capital expenditures over a one-year period. Positive values indicate increased investments in long-term assets, while negative values imply a reduction. Understanding CAPEX trends helps to gauge a company's future growth prospects.
Change in Common Equity: This formula measures the rate of change in a company's common equity relative to its total assets. It provides insights into the company's financial performance, capital structure, and shareholder ownership dynamics. An increase in common equity generally suggests stronger financial standing.
Inventory Growth 1yr: Inventory growth helps us understand the rate at which a company's inventory is expanding or contracting. This provides valuable insights into a company's inventory management practices and its ability to meet customer demand.
Cash and Short-Term Investments Change 1yr: This signal measures the growth or decline in a company's cash and short-term investments over a year. It provides a snapshot of a company's liquidity position and its ability to meet short-term obligations.
By combining these signals, we aim to build a well-rounded strategy that takes into account both short-term and long-term financial metrics, offering us a balanced view of a company’s financial standing. This amalgamation allows us to assess risks and opportunities from multiple angles, enhancing our ability to make robust investment decisions.
Strategy setup:
The investment strategy targets a variety of company sizes—mega, large, micro, and small—across the New York Stock Exchange and the Nasdaq. The model employs a 20-year training period and uses fixed annual accounting data for its inputs. The strategy is geared towards identifying companies that are likely to underperform, as evidenced by the negative direction (-1) on various financial metrics such as asset growth, inventory growth, CAPEX growth, changes in common equity, and others. No skip periods are applied, suggesting a continuous evaluation of all available data points.
On the analytics side, a simple average approach is used, with normalization scaling applied to the data. The portfolio is constructed using both equal- and value-weighting and is divided into 10 bins based on ordinal rank allocation. There is no set number limit per bin, and the holding period length for the assets is set to one year. This makes the strategy a multi-factor, contrarian approach that aims to capitalize on declining companies by betting against them. By using a broad spectrum of company sizes and financial indicators, this strategy seeks to create a diversified portfolio with the potential for high returns from poorly performing assets.
Performance
The strategy shows a promising Sharpe Ratio of 0.87, which is a measure of risk-adjusted returns. Given that a Sharpe Ratio above 1 is generally considered excellent, a value of 0.87 signals that the strategy provides a good return for the level of risk it assumes. This compares favorably to the market's excess return of 0.62 on a Sharpe Ratio basis.
Volatility for the strategy is measured at 22.07% on an annualized basis. Although this is higher than the market's volatility of 16.59%, the elevated average return seems to compensate for this higher level of risk. Moreover, the strategy's low turnover rate of 0.01% suggests that it isn't excessively trading and incurring high transaction costs, which can eat into the profits.


The alpha value of 7.84%, supported by a t-stat of 3.69, signifies that the strategy has a statistically significant positive performance not explained by market movements. This is an important indicator for investors looking for a strategy that adds value beyond just mimicking broader market trends.
Lastly, the beta of 1.08 suggests a slightly higher volatility compared to the broader market, but it also indicates the potential for higher returns. With a t-stat of 29.63 for the beta, the sensitivity of the strategy's returns to the market returns is statistically significant.
In summary, this strategy not only outperforms the market in terms of raw returns but also on a risk-adjusted basis. The additional risk, as indicated by a higher volatility and beta, seems to be well-compensated by higher average and risk-adjusted returns.
Copyright © 2023 Juline Quant Inc.