Tuesday, March 15, 2022

What is Asset Growth?
Asset growth is like watching a tree grow over time. If you plant a small tree and then, a year later, it has many more branches and leaves, it's growing well! Similarly, in the business world, asset growth measures how a company's possessions or "assets" (like money, buildings, or equipment) have grown over a certain period, usually one year. Just like with the tree, if a company's assets have increased, that's a sign that the company is growing and doing well. On the flip side, if the assets have decreased, the company might be facing some challenges, like a tree that loses leaves.
Strategy Based on Asset Growth in the United States
In the U.S., some investors like to look at a company's asset growth to decide if they should buy the company's stock. A study showed that companies with high asset growth often have lower stock returns later on. It's like a tree that grew too quickly and then had trouble staying healthy. So, some investors may choose to buy stocks of companies that are not growing their assets too quickly but are still steady and stable. This is because they think these companies will offer better stock returns over time. It's a bit like betting on a tree that grows steadily and healthily, rather than one that shoots up quickly only to struggle later.
Strategy Charactrictiscts
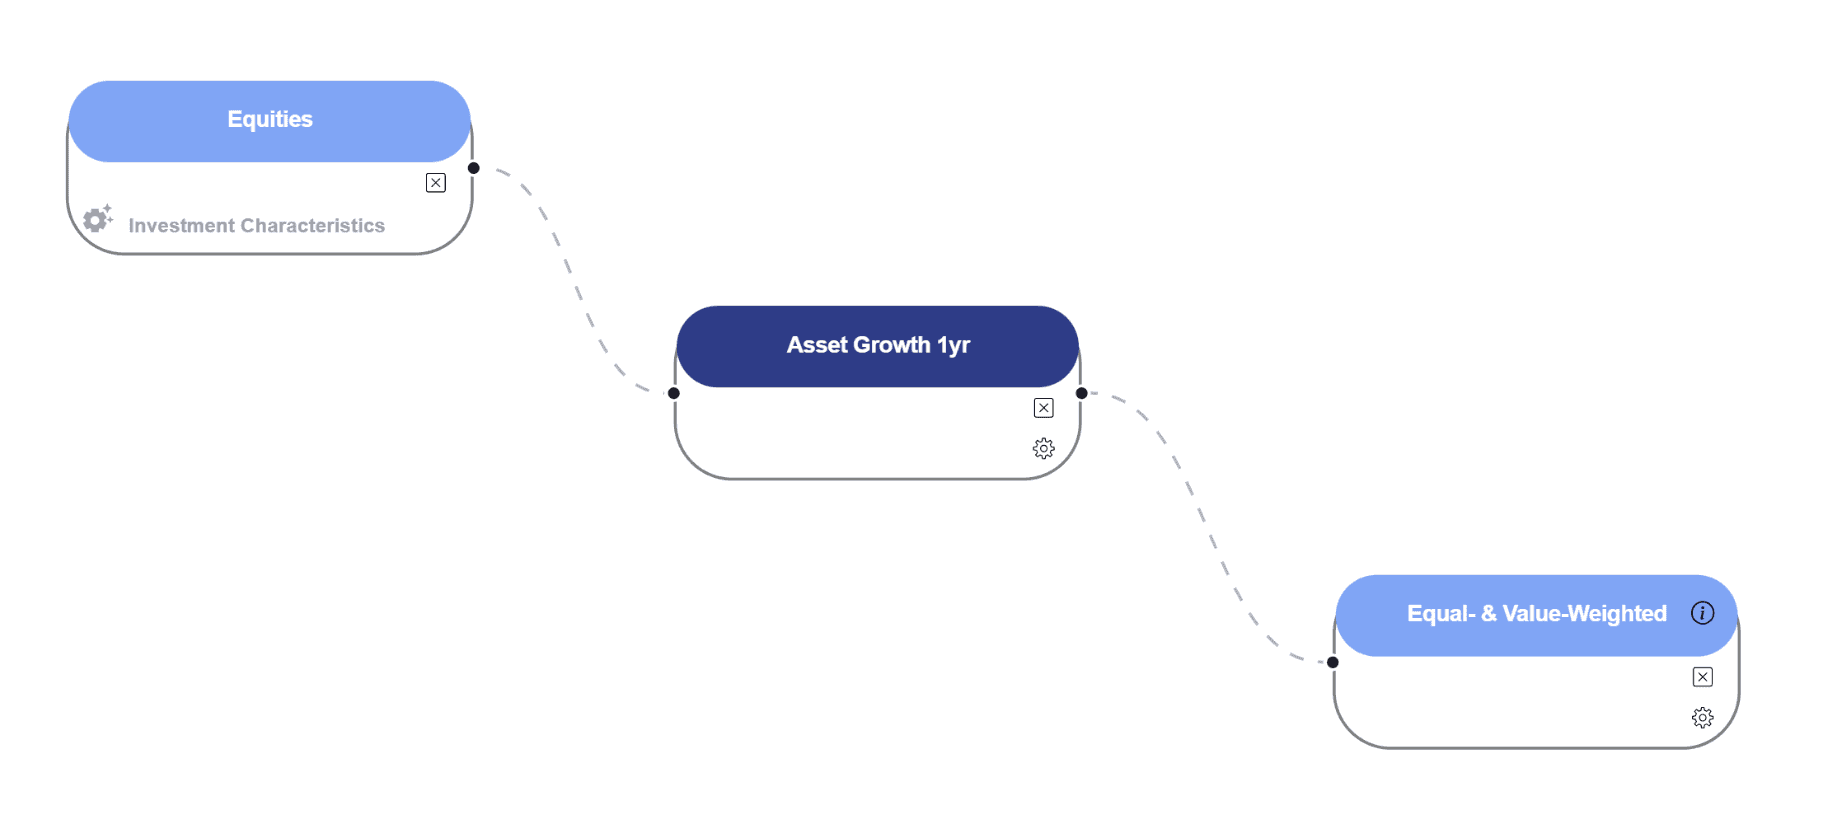
This strategy targets companies listed on the New York Stock Exchange and the Nasdaq in the United States. It encompasses firms of all sizes: Mega, Large, Micro, and Small while removing Nano stocks (stocks with market cap lower than 1% of the NYSE stocks). The approach uses fixed annual accounting data for its calculations.
Key Parameters:
The primary metric used is 1-year asset growth
There are no skip periods, meaning the strategy is continuously active.
Portfolios are divided into 10 bins based on asset growth, using ordinal rank allocation.
There is no limit on the number of companies that can be included in each bin.
Investments are held for a period of one year before re-evaluation.
Performance Summary (Equal-Weighted):
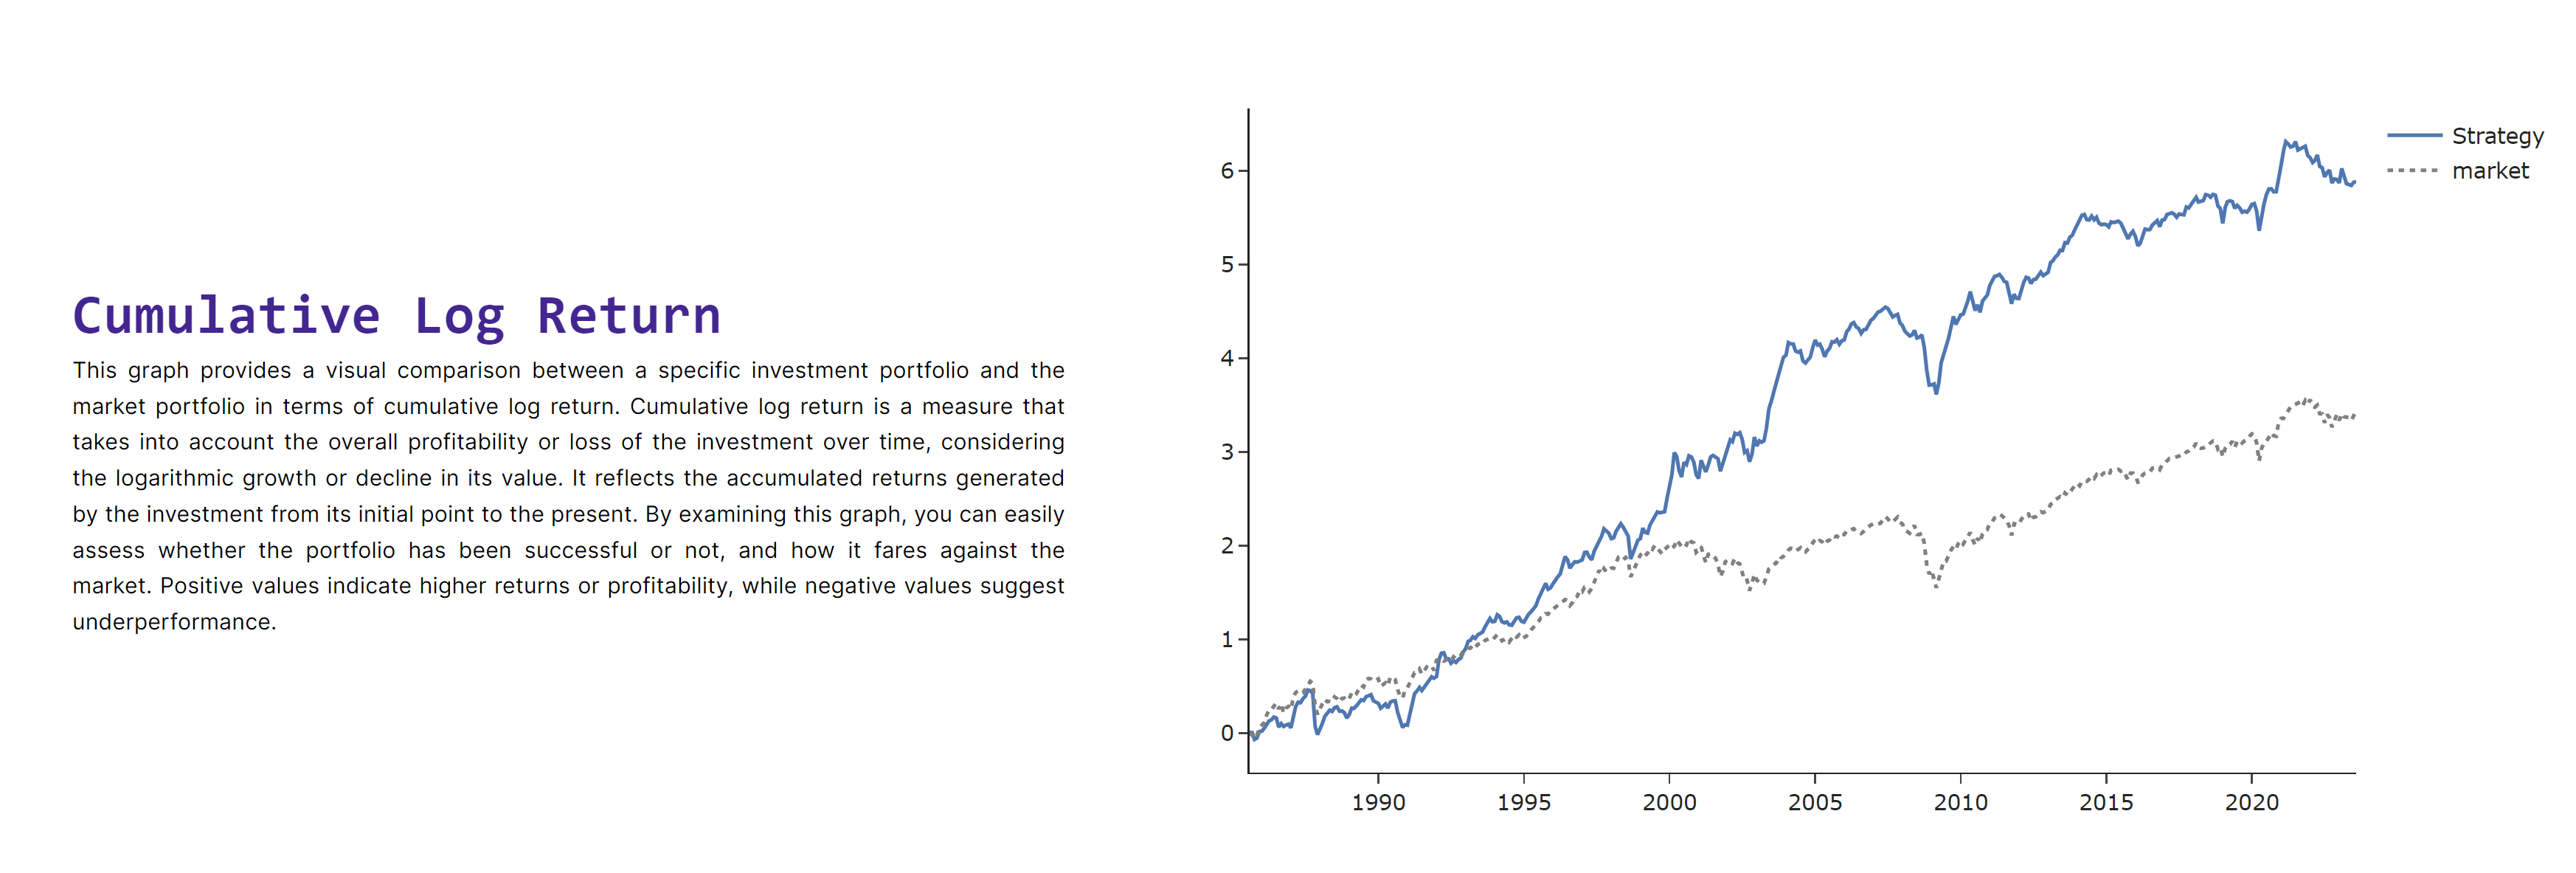
The strategy's equal-weighted portfolio exhibits a promising performance profile with an annualized Sharpe ratio of 0.76. This indicates that the portfolio has provided a reasonable level of return for the level of risk taken. In terms of market excess return, the portfolio has achieved a respectable 0.62, while contributions from momentum and size stand at 0.24 and 0.03 respectively. Interestingly, the value factor has a negative contribution at -0.10. The average annual return of the portfolio is an impressive 18.36%, outperforming market excess returns, which stand at 10.44%. Momentum and size contributed 4.44% and 0.36% to the returns, respectively, while value dragged it down by 1.20%.
In terms of volatility, the portfolio shows an annualized figure of 23.76%, which is higher compared to the market excess return volatility of 16.59%. This suggests that the portfolio carries a higher level of risk, but that seems to be well-compensated by its returns. Portfolio turnover is exceptionally low at 0.01%, indicating minimal trading and lower transaction costs. The portfolio's annualized CAPM Alpha stands at 6.66%, with a t-stat of 2.72, suggesting that the strategy has generated significant excess returns that can't be explained solely by its exposure to the market risk. The Beta according to CAPM is 1.12, with a very high t-stat of 26.66, indicating a higher sensitivity to market movements. Overall, the strategy appears to be effective, but investors should be aware of its higher volatility.


Modified Strategy Incorporating Price Momentum Alongside Asset Growth
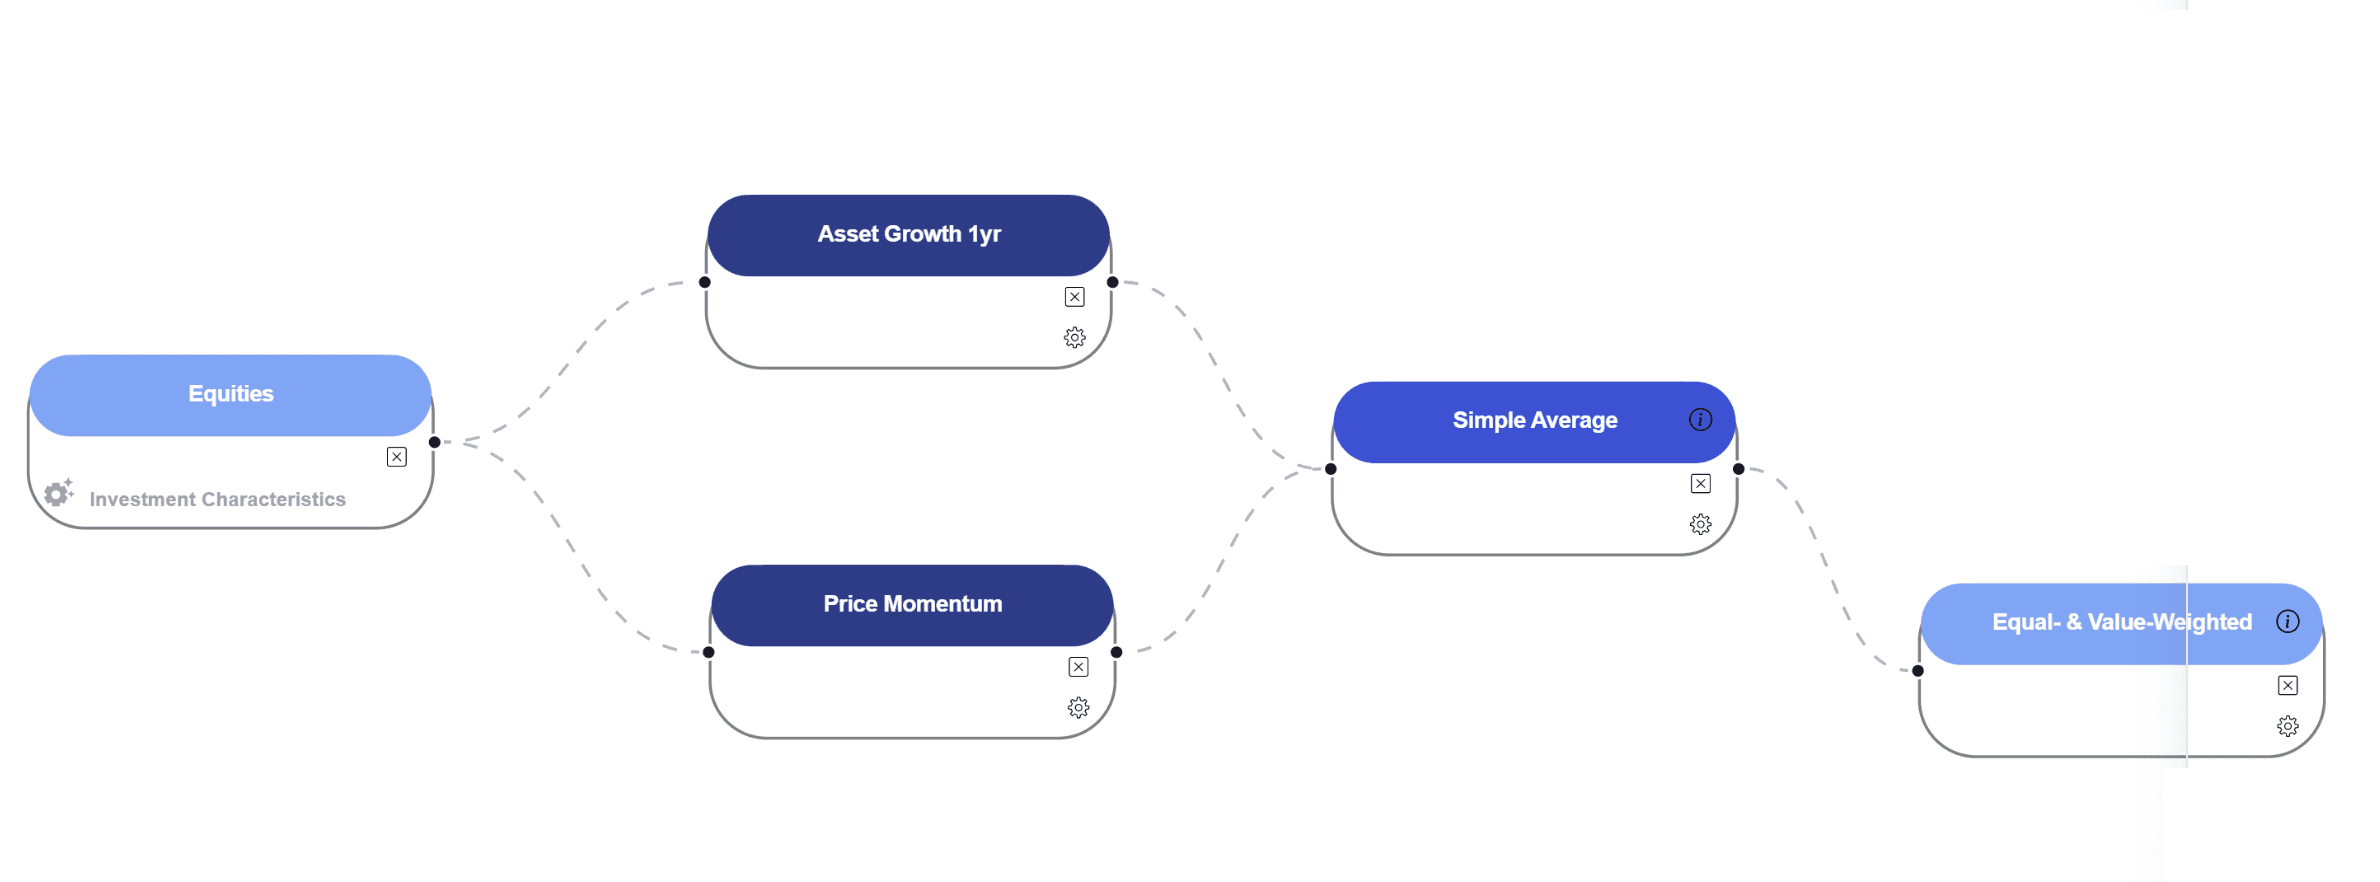
The updated investment strategy continues to focus on companies listed on the New York Stock Exchange and the Nasdaq in the United States, spanning Mega, Large, Micro, and Small-sized firms. The strategy remains trained over a 5-year period and relies on fixed annual accounting data. However, it now introduces a new parameter: Price Momentum, with a directional value of 1, suggesting that higher momentum is favorable. The formation period for momentum is 11 months, and like the asset growth parameter, there are no skip periods.
Both Price Momentum and 1-year Asset Growth are combined using a simple average approach, with no scaling applied. The portfolio continues to be divided into 10 ordinal rank-allocated bins and can be either equal- or value-weighted. There are no limits on the number of companies per bin, and the holding period remains at one year.
By incorporating Price Momentum alongside Asset Growth, the strategy aims to capture the benefits of trending stocks while still accounting for the stability associated with lower asset growth. This could potentially enhance the portfolio's risk-adjusted returns, offering a more nuanced approach than relying solely on asset growth.

Comparative Analysis: Enhanced Strategy with Momentum vs. Original Asset Growth Strategy
The modified strategy, which incorporates Price Momentum alongside Asset Growth, shows a noticeable improvement in performance metrics compared to the original asset growth-only strategy. The annualized Sharpe ratio has increased to 0.90 from the previous 0.76, indicating better risk-adjusted returns. The average annual return has also seen an uptick, going from 18.36% to 20.04%. Contributions from market excess return, momentum, and size remained consistent between the two strategies, while the negative impact of the value factor has slightly lessened from -1.20% to -1.08%.

Interestingly, despite better returns, the new strategy has a slightly lower volatility of 22.52% compared to the original strategy's 23.76%. This suggests improved efficiency in risk management. Turnover remains extremely low at 0.01% in both strategies, keeping transaction costs minimal.

In terms of alpha, which represents the excess return over what can be explained by the market’s overall movements, the new strategy has an annualized CAPM Alpha of 8.89%, which is substantially higher than the previous 6.66%. The t-stat has also increased to 3.89 from 2.72, adding more statistical validity to the strategy's outperformance. The Beta has slightly decreased to 1.07 from 1.12, but with a higher t-stat of 27.37, indicating a more consistent relationship with market movements.
Overall, the modified strategy that includes Price Momentum along with Asset Growth seems to offer better risk-adjusted returns, higher average returns, and a slightly lower volatility compared to the original asset growth-only strategy.
Conclusion
In this analysis, we examined two distinct investment strategies focused on U.S. stocks: one that solely relied on Asset Growth and another that incorporated Price Momentum alongside Asset Growth. The results suggest that the latter strategy, which combines both Asset Growth and Price Momentum, offers superior performance across multiple metrics.
The strategy that included Price Momentum showed a higher Sharpe ratio, increased average annual returns, and slightly reduced volatility compared to the Asset Growth-only strategy. Moreover, the addition of momentum resulted in a higher annualized CAPM Alpha, adding more statistical validity to the strategy's outperformance.
Therefore, based on the observed metrics, incorporating Price Momentum alongside Asset Growth appears to offer better risk-adjusted returns and may be a more effective investment strategy.
Copyright © 2023 Juline Quant Inc.