Sunday, February 6, 2022
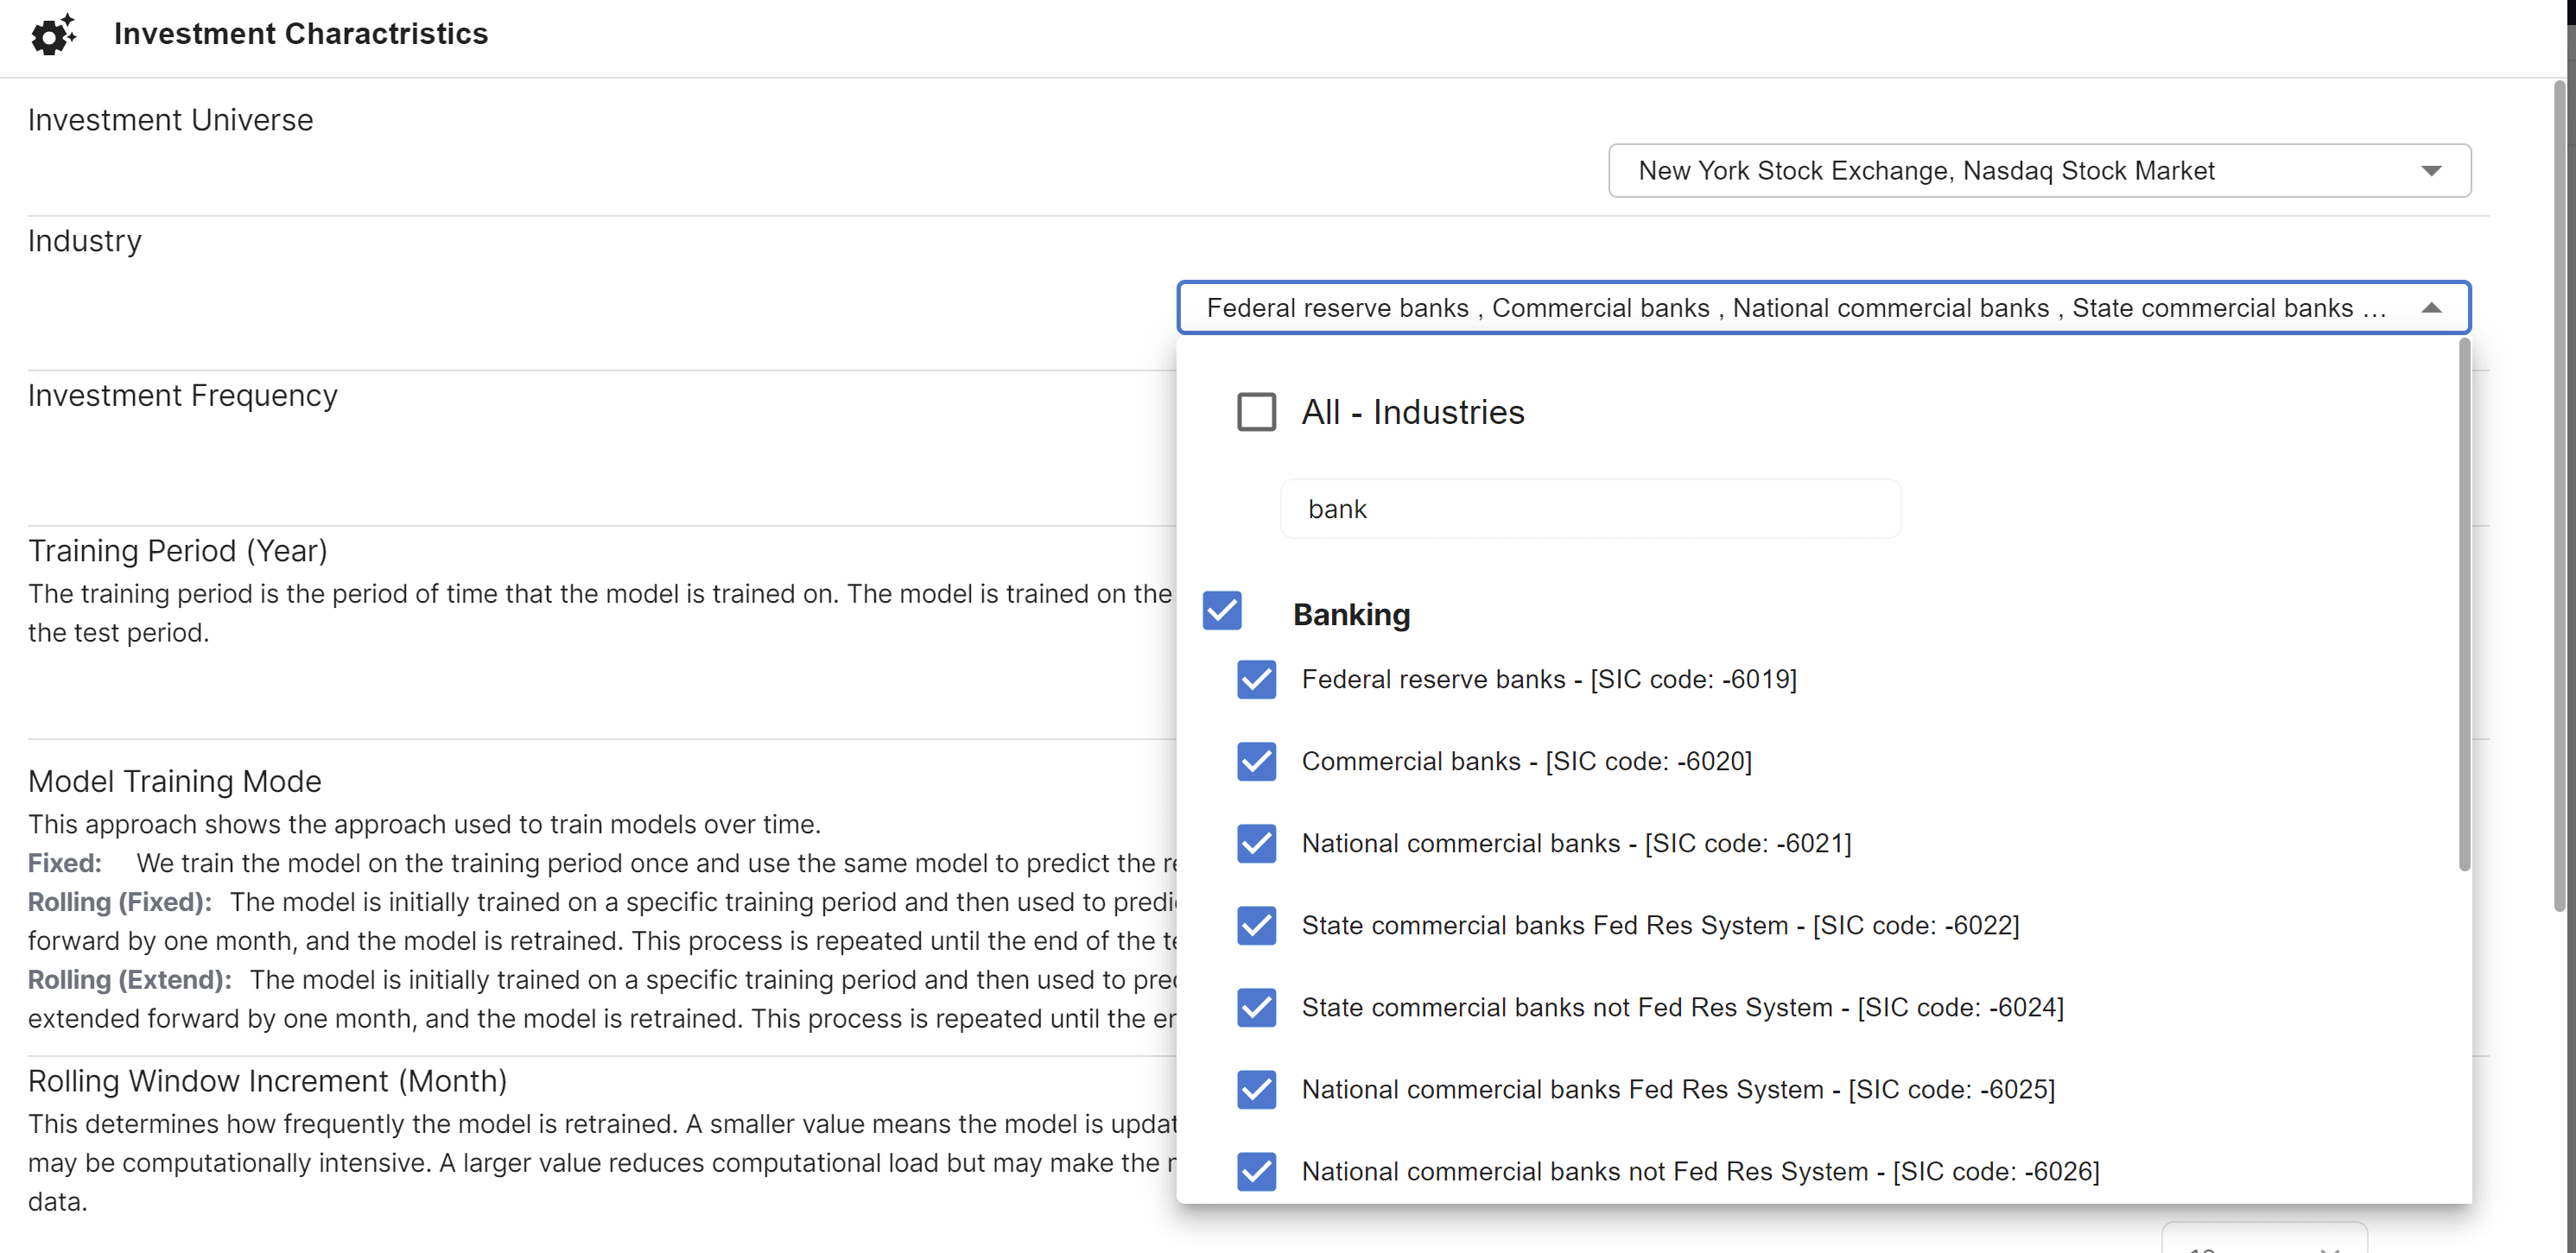
In the intricate landscape of financial markets, the banking sector stands as a cornerstone that directly influences economies worldwide. Within this sector, the application of various investment strategies—specifically momentum, size, and value—has long been the subject of scholarly investigation and practical scrutiny. Yet, while individual studies have offered valuable insights into the effectiveness of each strategy, a comprehensive comparison remains a crucial but understudied area. This article aims to bridge that gap by rigorously evaluating and contrasting the performance of momentum, size, and value strategies within the banking sector, offering investors and policymakers alike a holistic understanding of possible mispricing in the financial sector.
We do this by filtering the industries to the financial sector.

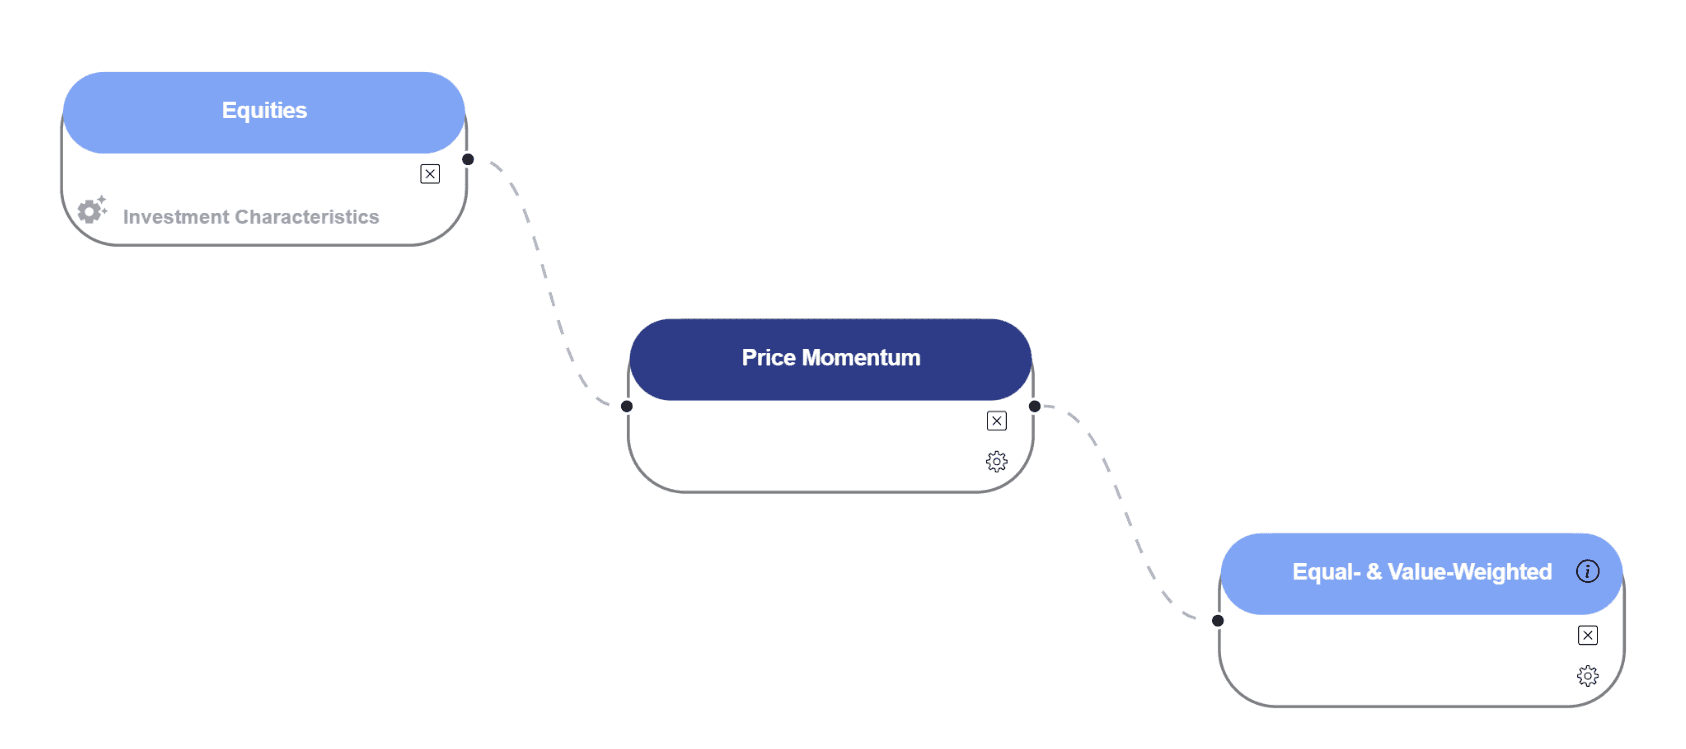
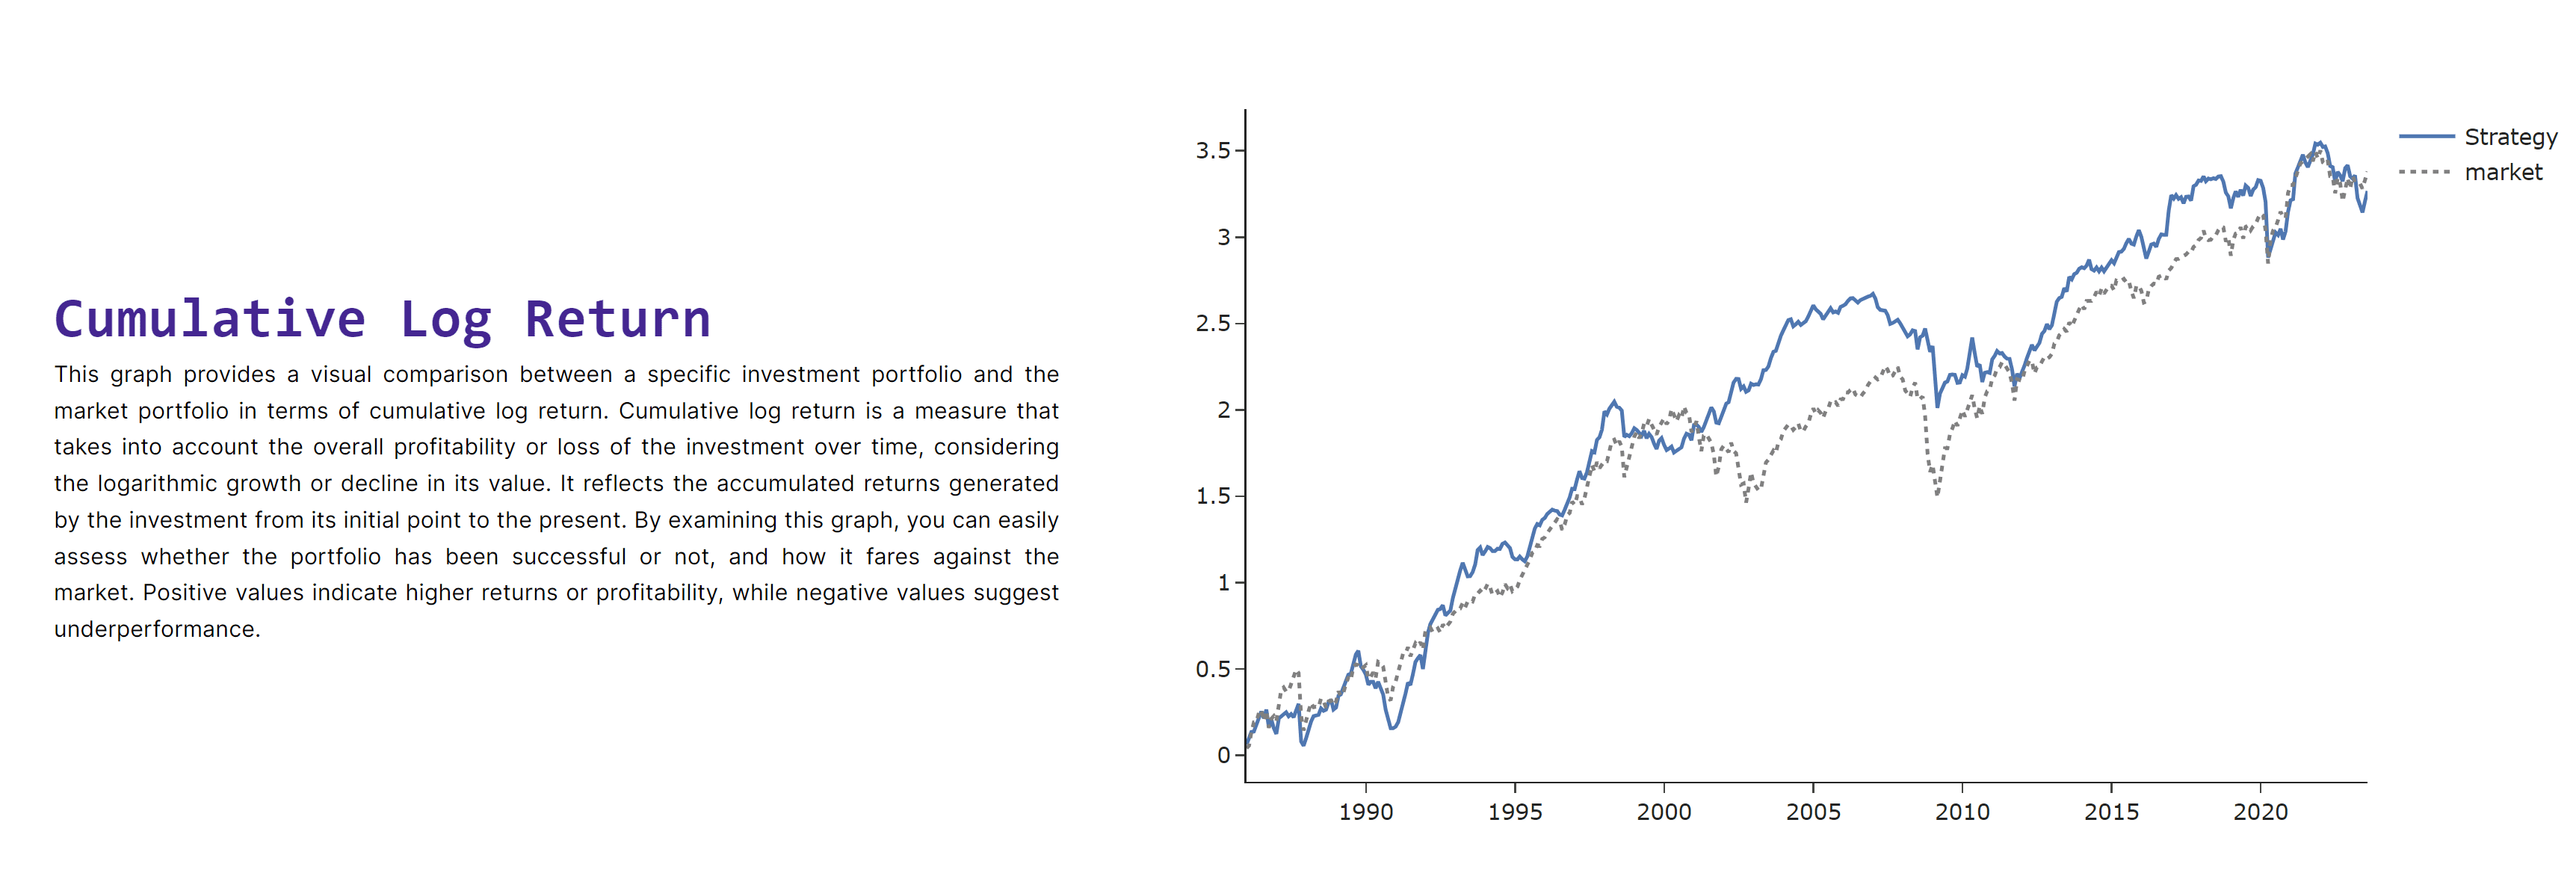
Momentum
The investment strategy has an annualized Sharpe Ratio of 0.62, which is in line with the market's excess return Sharpe Ratio of 0.62. This indicates that the strategy offers a comparable risk-adjusted return to the broader market. In addition, the strategy has generated an annualized Alpha of 2.98%, suggesting that it has the potential to outperform the market when the risk is accounted for. However, it's worth noting that the t-stat of 1.62 for the Alpha is below the commonly accepted threshold for statistical significance. Overall, the strategy exhibits a moderate risk-adjusted performance, closely mirroring the broader market, while also generating a positive, though not statistically significant, Alpha.
Size
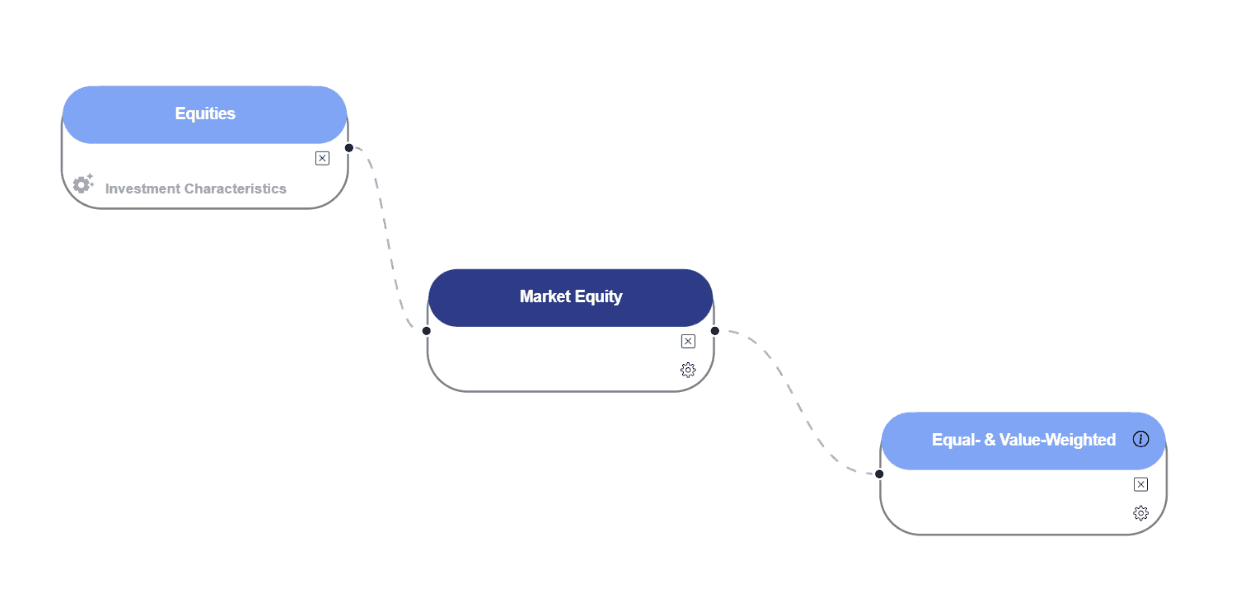
The investment strategy focused on size has an annualized Sharpe Ratio of 0.76, outperforming the broader market's Sharpe Ratio of 0.62. This suggests that the size-based strategy offers superior risk-adjusted returns compared to the market. Furthermore, the strategy has generated a substantial annualized Alpha of 6.57%, which is notably higher than the broader market and indicates the strategy's ability to generate excess returns over the market when risk is considered. The t-stat of 2.92 for this Alpha implies that the outperformance is statistically significant at conventional levels. Overall, the size-based strategy has shown strong risk-adjusted performance, as indicated by its higher Sharpe Ratio and statistically significant Alpha, making it an attractive option for investors seeking to beat the market.
Value
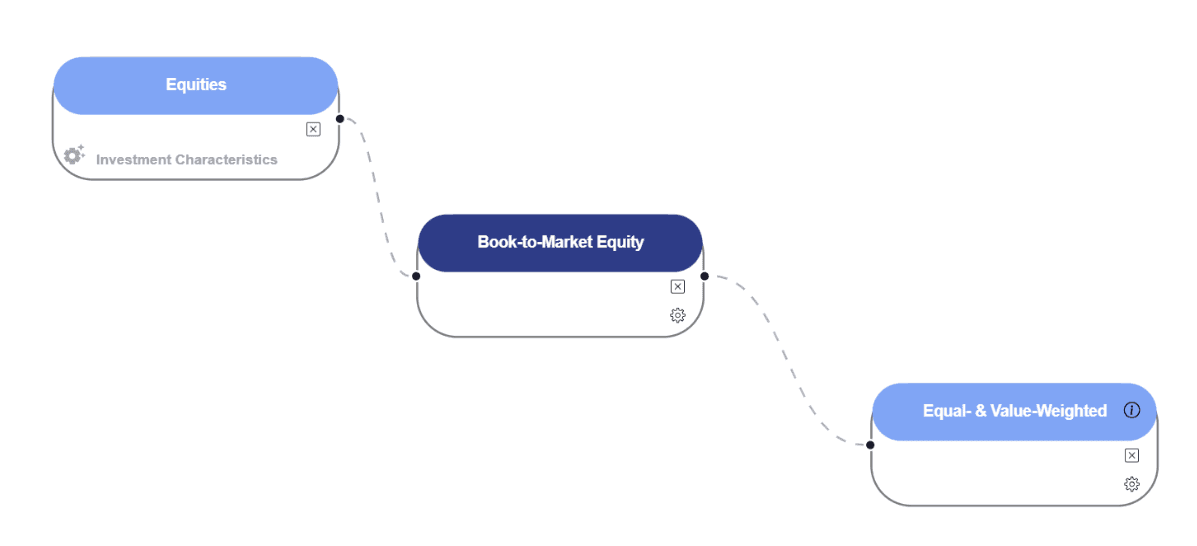
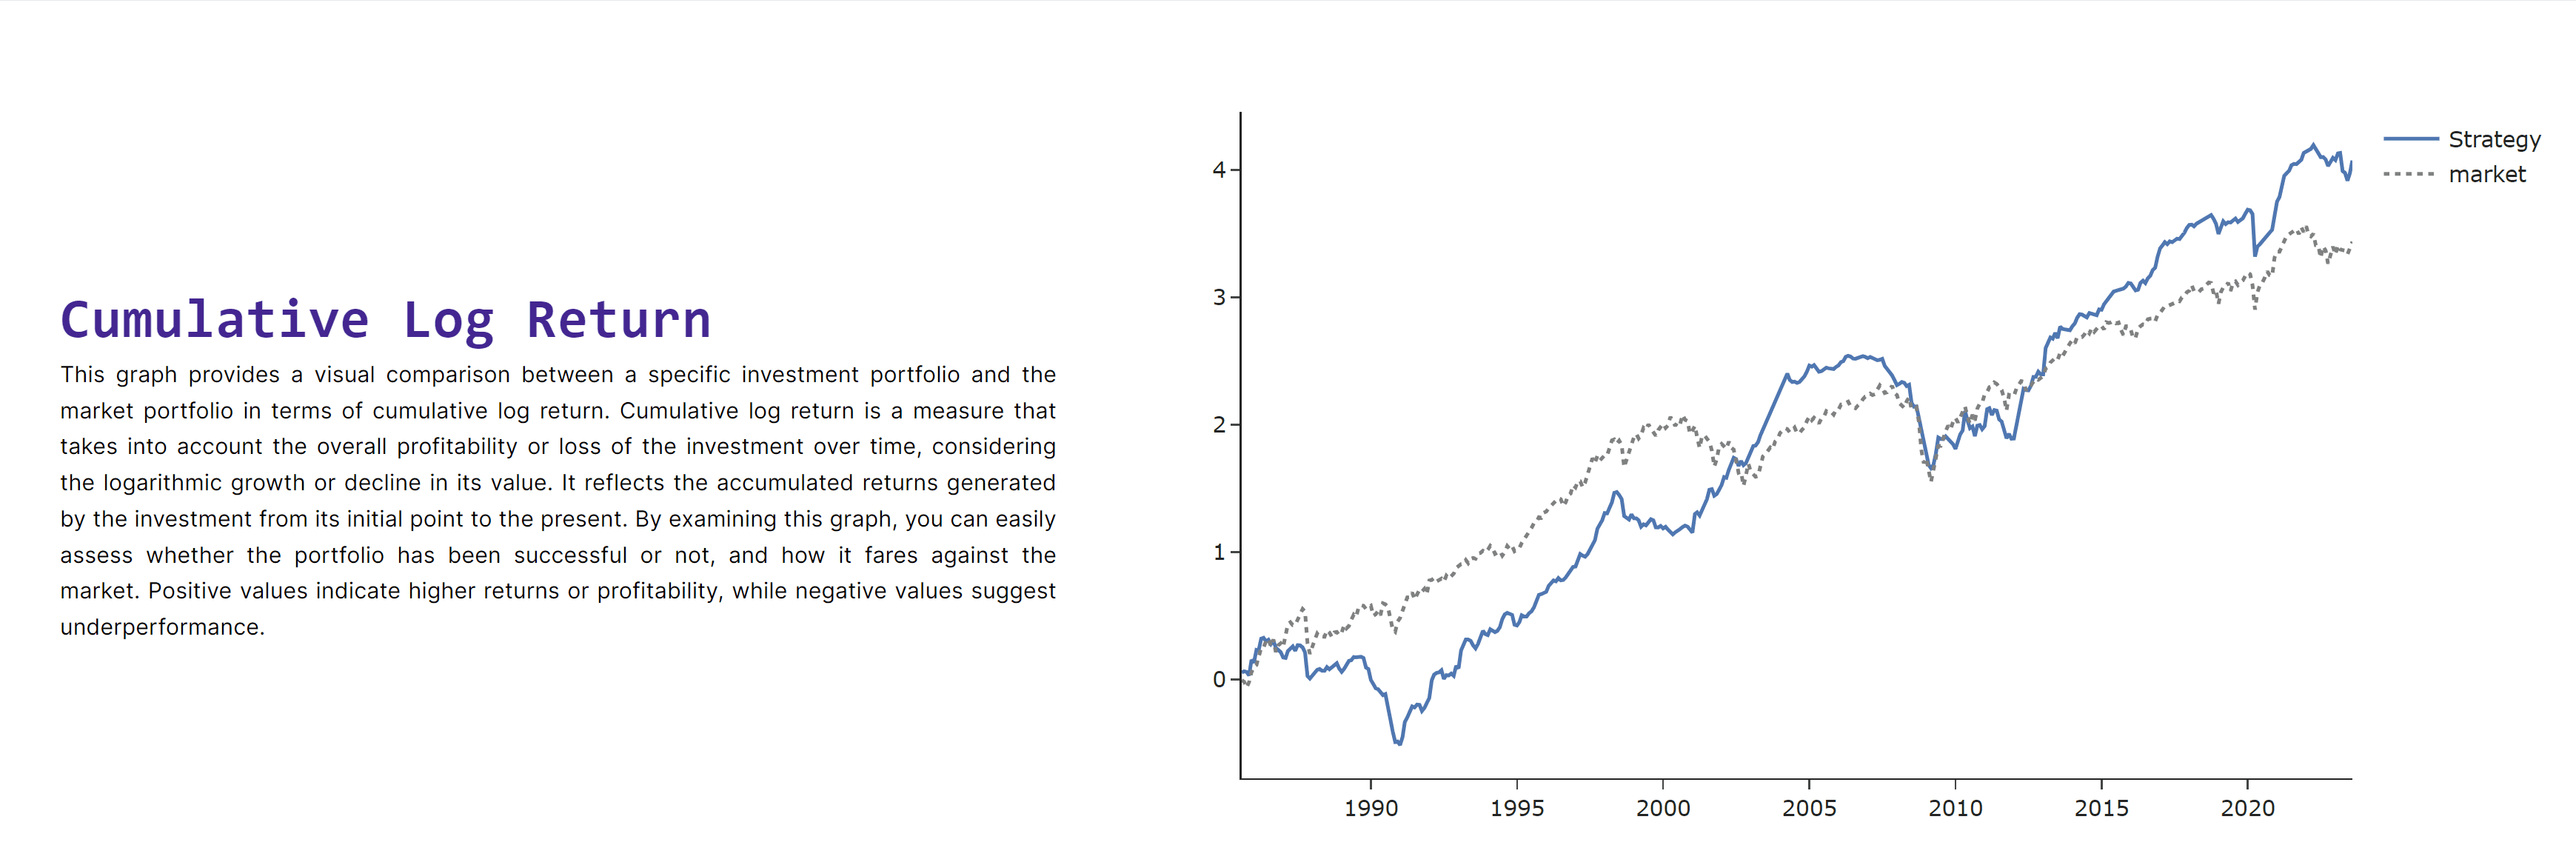
The investment strategy in question has an annualized Sharpe Ratio of 0.69, which is higher than the market's excess return Sharpe Ratio of 0.62. This indicates that the strategy offers better risk-adjusted returns compared to the broader market. Additionally, the strategy has achieved a notable annualized Alpha of 7.06%, suggesting significant ability to generate returns above the market when accounting for risk. The t-stat value of 2.51 for the Alpha indicates that this outperformance is statistically significant at conventional thresholds. Overall, this strategy has demonstrated robust risk-adjusted performance, as evident from its higher Sharpe Ratio and statistically significant Alpha, positioning it as a strong contender for investors aiming to outperform the market.

Conclusion
The investment strategies focusing on Momentum, Size, and Value each show varying degrees of risk-adjusted performance and alpha generation. The Momentum strategy aligns closely with the market in terms of Sharpe Ratio and generates a positive but statistically insignificant Alpha, suggesting potential mispricing but without strong evidence. The Size strategy outperforms the market in both Sharpe Ratio and Alpha, with statistical significance, indicating both mispricing and the opportunity for above-market returns. Similarly, the Value strategy also has a higher Sharpe Ratio than the market and produces a statistically significant Alpha, further pointing to mispricing and the opportunity for outperformance. Overall, all three strategies show evidence of Alpha, suggesting the presence of mispricing in the market, but the Size and Value strategies stand out for their statistically significant Alphas and higher risk-adjusted returns.
Copyright © 2023 Juline Quant Inc.